Essay
An AI operating playbook for acquired software companies, every lever tied to the P&L
Thirteen functions, three horizons, and one bridge from 25% to 41% EBITDA in a $10M ARR vertical software company, with every benchmark graded by how much to trust it and the guardrails that healthcare data imposes.
The first value creation plan I was handed as a private-equity CEO had forty-one initiatives on it. It had been written before I arrived, by capable people, and it was useless. Not one line said which P&L account it moved, what the number was on the day the plan was written, or the date by which it would be stopped if the number had not moved. Eighteen months later most of the forty-one were "in progress," and the board was asking why the margin looked the way it did.
I have since read a dozen AI value creation plans for software companies and most of them have the same defect in a new costume. They list tools. They count pilots. They report hours saved by people who were asked whether they saved hours. What they do not do is connect the work to a line on the income statement in a way that a CFO could audit.
This essay is the plan I would run instead. It is written for the two people who have to make an acquired vertical software company worth more than it was at close: the operating partner who owns the bridge, and the CEO who has to deliver it with sixty people, a twelve-year-old codebase, and customers who bought from the founder. It is long because the work is long. Every function gets its own chapter, its own metrics, and an honest grade on the evidence behind them. The illustrative company is a composite: $10M of ARR, 25% EBITDA, 60 employees, serving post-acute and community-based care providers. Every number attached to it is a modeling assumption to be replaced with the acquired company's own.
The claim
AI creates value in an acquired software company only when four conditions hold at once. Every initiative carries a P&L line, a measured baseline, a named owner, and a kill date. Pricing is decided before automation touches anything the customer pays for. A product customers pay for ships inside twelve months of close. And the three horizons run in order: Deploy pays for Reshape, and Reshape funds Invent. Remove any one of the four and the program produces activity rather than earnings, which is what most of them produce today.
That is a falsifiable claim. If a company runs pilots without P&L lines and still moves its margin sixteen points, I am wrong. The evidence so far says it does not happen. MIT's NANDA initiative reported in July 2025 that "95% of organizations are getting zero return" from generative AI, with "just 5% of integrated AI pilots ... extracting millions in value."1 The study's method is thin, and I come back to that in the objections, but Gartner's separate forecast points the same way: "over 40% of agentic AI projects will be canceled by the end of 2027, due to escalating costs, unclear business value or inadequate risk controls."2 In private equity specifically, FTI's 2026 survey of 200 fund and operating leaders found 36% of portfolio companies using AI across multiple use cases and 7% at enterprise scale.3 The gap between those numbers is the playbook.
How to read this
The three horizons are borrowed from the framing the large consultancies have used for AI in portfolios, and they are useful because they separate three different kinds of work that get confused in most plans. Deploy means putting proven, purchasable tools onto existing workflows: support agents, coding assistants, close automation. Reshape means changing how a function is organized because the tools made the old shape obsolete: implementation as a self-serve product, finance as a two-person team with agents, support and success merged into one customer team. Invent means new revenue: AI modules customers pay for, pricing that moves with the value delivered, services converted into software.
The order is the point. Deploy is where the cheap, well-evidenced savings are, and they fund the harder organizational work. Reshape is where the margin structure changes. Invent is where the multiple changes, and McKinsey's June 2026 analysis of 471 PE-backed companies is blunt about why: companies that embed AI in their product or business model trade at a median revenue multiple "approximately 130 percent higher" than opportunistic users, while companies that use AI only for internal productivity trade at 14x against 13x for the opportunists. Markets, McKinsey says, "do not materially differentiate" productivity-AI from doing nothing.4 Internal efficiency is table stakes every competitor can buy. The durable value is in what the customer pays for.
Section 1 gives the illustrative company. Section 2 is the P&L map, one row per line, with the levers that move it and a grade on the evidence. Section 3 walks the thirteen functions. Section 4 assembles the bridge. Sections 5 through 9 cover sequencing, the operating model, the data and security foundation, the healthcare regulatory constraints, and how value is measured. Section 10 is the catalogue of failure modes. Section 11 is the strongest objection to the whole enterprise, and where it is right.
A note on the evidence. A playbook like this necessarily leans on vendor case studies, because vendors are the ones measuring their own deployments. I have tried to grade every figure: independent studies and regulators are marked as such, vendor results with a named customer are marked (V), and vendor results without one are marked (V, anonymous). Where the evidence is thin, the chapter says so and treats the lever as something to measure internally rather than assume. Where a source's number turned out to be softer than it is usually quoted, I give the source's own wording. Several widely repeated figures did not survive that check, and I say which.
Ten operating principles
These are the rules the rest of the document obeys. They are stated once here so that the function chapters can refer to them rather than restate them.
- Price before you automate. Every efficiency gain in a function that touches the customer is preceded by a decision about how the customer pays. Automating implementation before converting it from hourly fees to a platform tier turns a revenue line into a cost saving.
- Buy before you build. In the MIT NANDA sample, "external partnerships with learning-capable, customized tools reached deployment ~67% of the time, compared to ~33% for internally built tools."1 We build only where the workflow is our product or the data is proprietary.
- Measure the P&L, never the pilot. Tickets touched, prompts run, and hours reportedly saved are inputs. The outputs that count are dollars on a P&L line, points of retention, or days of working capital.
- Redeploy before you reduce. The first year of capacity freed by agents goes to growth: onboarding more customers, expansion, shipping product. Headcount falls through attrition and role redesign, and the cost line falls with it. This protects retention through the ownership transition.
- Humans stay on money and patients. No agent makes a final decision on a customer invoice, a payer claim, a medical-necessity determination, or a care plan. Agents draft, route, and recommend; a person signs.
- PHI travels only through covered endpoints. Protected health information reaches a model only through a provider under a business associate agreement, with the retention terms that agreement actually allows. Everything else is de-identified first. Prompts and outputs containing PHI are logged as electronic PHI.
- Agents are staff. Every production agent has an owner, a job description, a permission scope, an evaluation set it must pass before deployment and after every model change, and a row in the agent register that is reviewed monthly.
- Ship to customers inside twelve months. The first customer-facing AI module ships within a year of close.
- One data foundation. Nothing here works on a company whose customer, usage, support, and financial data live in disconnected systems. The warehouse, the event stream, and the knowledge base are built in the first hundred days.
- Kill dates are real. Every initiative has a date by which it must show measured value against its baseline. We cancel ours on schedule rather than let them drift.
1. The illustrative company
The composite is deliberately ordinary: founder-owned vertical software for post-acute and community-based care agencies, $10M ARR growing 8% to 10%, 92% gross retention, 60 employees, 25% EBITDA. Its cost structure sits near the SaaS Capital 2026 medians for private B2B SaaS in the $3M to $5M ARR band, which SaaS Capital reports as 5% hosting, 3% DevOps, 5% professional services cost of goods, 3.5% other COGS, 10% customer support and success, 12% selling, 8% marketing, 24% R&D and 15% G&A, all as a share of ARR.5 Support and services in the composite run somewhat heavier than median because the customers are small agencies that lean on the vendor, and sales and marketing run lighter because the founder still closes the largest deals.
| Line | % of revenue | $M | Headcount | Notes |
|---|---|---|---|---|
| Revenue (ARR) | 100% | 10.00 | ~450 customers, ~$22K average ACV, per-user pricing unchanged since 2021 | |
| Hosting | 5% | 0.50 | Single cloud, little reserved capacity, no FinOps discipline | |
| DevOps and platform | 2% | 0.20 | People counted in IT, security and DevOps below | |
| Other COGS | 1% | 0.10 | Third-party data, SMS, payments | |
| Support and success | 10% | 1.00 | 8 support, 4 CS | Phone and email, no deflection, 2,200 tickets a month |
| Professional services | 5% | 0.50 | 5 | Implementation billed hourly at a loss; 6- to 10-week go-lives |
| Gross margin | 77% | 7.70 | ||
| Sales | 9% | 0.90 | 8 | Founder-led plus 4 AEs, 2 SDRs, referrals and trade shows |
| Marketing | 5% | 0.50 | 3 | Events and a small content program |
| R&D | 23% | 2.30 | 18 | Product, engineering, QA; 12-year-old codebase with a modern front end |
| G&A | 15% | 1.50 | 7 plus 4 exec | Finance, HR, admin, legal spend, executives; 12-day close |
| IT, security, DevOps | in lines above | 3 | SOC 2 in progress, HIPAA program largely manual | |
| EBITDA | 25% | 2.50 | 60 total | ARR per employee $167K |
Two numbers in that table define the size of the opportunity. Support, success, and implementation together consume 15% of revenue and 17 people to serve 450 customers, which is the cost of a product that needs humans to operate it. And R&D at 23% of revenue produces two or three meaningful releases a year, which is the cost of a codebase that resists change. Both are typical of the category. SaaS Capital's 2026 median ARR per employee is $141,125 across all private SaaS companies and $177,240 for bootstrapped companies in the $5M to $10M band, so $167K is unremarkable.6 Both numbers are also where agents earn their keep first.
The retention baseline matters too. SaaS Capital's 2026 survey puts median net revenue retention for bootstrapped SaaS companies between $3M and $20M of ARR at 103% and median gross retention at 91%.7 Our composite's 92% gross and 101% net is a company that keeps its customers and sells them nothing more.
2. The P&L map
Every lever in this playbook lands on a line of the P&L, the balance sheet, or the handful of metrics buyers use to value a software company. The table is the map; the chapters in Section 3 are the detail. Targets are for the illustrative company at the end of year three and are assembled into a full bridge in Section 4. The final column is the grade that matters most: how far the published evidence supports the target, as opposed to the target being something we intend to measure ourselves.
| P&L line or metric | At close | Year 3 target | Primary levers (chapter) | Evidence strength |
|---|---|---|---|---|
| Revenue growth | 8% to 10% | 10% to 12% sustained | Pricing (3.4), AI modules (3.5), sales (3.8), marketing (3.9) | Medium; pricing strongest |
| Price realization | Flat since 2021 | +6% cumulative on the base | Value-based tiers with AI modules (3.4) | Strong |
| Gross retention | 92% | 94% to 95% | Health scoring, proactive success, AI features (3.3, 3.5) | Medium; forecast accuracy proven, retention delta not |
| Net retention | 101% | 108% to 110% | Modules, packaging, expansion (3.3, 3.4, 3.5) | Medium |
| Hosting and platform | 7% | 6% | FinOps, autoscaling, workload optimization (3.7) | Strong |
| Support and success | 10% | 5% | Agent-first support, self-serve, merged team (3.1, 3.3) | Strong |
| Professional services COGS | 5% | 3% | Migration agents, guided onboarding, repriced implementation (3.2) | Weak; measure internally |
| Sales | 9% | 10% (absolute up) | AI SDR, research, call intelligence, proposals (3.8) | Medium |
| Marketing | 5% | 6% (absolute up) | Content engine, ABM research, event follow-up (3.9) | Weak; organic search headwinds |
| R&D | 23% | 18% | Coding agents, test generation, modernization, QA discipline (3.6) | Medium; company-level data stronger than task-level |
| G&A | 15% | 10% | Close, AR, AP, FP&A, HR helpdesk, contracts, compliance automation (3.10 to 3.12) | Strong |
| EBITDA margin | 25% | 41% | All of the above | |
| DSO | 55 days | 38 days | Collections agents, invoice accuracy, dunning (3.10) | Strong |
| Days to close the books | 12 | 4 | Reconciliation, accrual and reporting agents (3.10) | Strong (independent study) |
| ARR per employee | $167K | $260K | Every chapter; headcount plan in Section 4 | Strong (Vista, SaaS Capital) |
Two grades deserve a word. Professional services is marked weak because no vendor publishes a clean before-and-after on implementation cost per customer, so the target rests on our own measurement program rather than on anyone else's. Gross retention is marked medium because the published evidence proves that health-scoring models forecast churn accurately, which is a different thing from proving that they prevent it. I treat forecast accuracy and success-team capacity as the proven gains and set the retention target conservatively.
3. The levers, function by function
Each chapter follows the same structure so that function leads can plan against it directly: where the money is, what the agents do, what the evidence says, the metrics and targets, what has to be in place first, and where the guardrails sit. "Typical at close" figures describe the illustrative company; year 1 and year 3 are targets.
3.1 Customer support
Where the money is. Support is 10% of revenue, eight people, and 2,200 tickets a month for 450 customers. About 60% of tickets are how-to questions, password and access issues, report requests, and billing questions that a well-grounded agent resolves without a human. Another 25% need a human but can be drafted, routed, and pre-investigated by an agent. The remainder are product defects and escalations.
Target. Support and success cost from 10% to 5% of revenue by year three, with CSAT held at or above the level at close and first-response time under two minutes. Headcount from eight to four through attrition, with people redeployed to success and onboarding where the fit is right.
What the agents do. The core is a tier-1 resolution agent grounded in the knowledge base, product documentation, release notes, and the customer's own configuration and usage data. It resolves how-to, access, configuration, and report questions in chat and email, and escalates with a full summary and a suggested fix when it cannot. Around it sit four supporting agents. An assist agent drafts replies, pulls account history, surfaces similar resolved tickets, and proposes the next step for every ticket a person handles; this is where the 25% of tickets that need a human get faster. A knowledge agent turns resolved tickets, release notes, and recorded training sessions into articles, flags the articles that produce escalations, and rewrites them; the knowledge base becomes the product the support agent runs on, which is why it is maintained by an agent rather than a technical writer. A telemetry agent watches error logs, failed integrations, stuck claims, and unusual usage, and opens tickets before customers notice; in post-acute software the obvious triggers are electronic visit verification sync failures, rejected claims batches, and expiring authorizations. And a quality agent scores every conversation for resolution, sentiment, and root cause, replacing the manual ticket-tagging that support managers spend a day a week on.
Phone remains the channel of choice for small agencies, so a voice agent follows once chat and email are stable: identification, intent capture, and the same tier-1 scope, with a warm transfer to a human for anything else.
What the evidence says. Intercom reports that its Fin agent is "averaging 76% across 12,000+ customers, with many seeing over 85%."8 The definition matters. Intercom counts a hard resolution when the customer confirms the answer helped and a soft resolution when the customer "exits the conversation without requesting further assistance within 24 hours of Fin's last answer," so a portion of that 76% is silence. Lorikeet's 2026 benchmark, itself a vendor's synthesis of vendor data, says to "expect 40% to 60% at launch and 60% or more after 6 to 12 months of knowledge and workflow work," with best-in-class deployments at 84% or higher, and it notes that "containment runs about 20 points above resolution on the same conversations," citing Ada's 72% containment against 52% resolution.9 That gap is why we measure resolution, and why we define it as the customer confirming or not returning within seven days rather than the agent closing the ticket.
Klarna is the caution. In February 2024 its assistant "had 2.3 million conversations, two-thirds of Klarna's customer service chats," doing "the equivalent work of 700 full-time agents."10 By May 2025 its CEO was telling Bloomberg that "as cost unfortunately seems to have been a too predominant evaluation factor when organizing this, what you end up having is lower quality," and that "really investing in the quality of the human support is the way of the future for us."11 The independent evidence on augmentation is more encouraging than the evidence on replacement: Brynjolfsson, Li and Raymond's study of 5,179 support agents found a generative assistant "increases productivity, as measured by issues resolved per hour, by 14% on average, including a 34% improvement for novice and low-skilled workers but with minimal impact on experienced and highly skilled workers."12 We plan on 50% to 60% of ticket volume resolved by agents at maturity and a 40% to 50% headcount reduction, with the rest of the gain coming from faster human handling.
| Metric | Typical at close | Year 1 | Year 3 | P&L line |
|---|---|---|---|---|
| Tickets resolved by agent (true resolution) | 0% | 40% | 60% | Support and success |
| Cost per ticket | $38 | $24 | $14 | Support and success |
| First response time | 4 hours | 10 minutes | Under 2 minutes | Retention (indirect) |
| CSAT | Baseline | Baseline or better | Baseline +5 pts | Retention (indirect) |
| Support headcount | 8 | 6 | 4 | Support and success |
| Support and success, % of revenue | 10% | 7.5% | 5% | Gross margin |
What it takes. A single ticketing system with clean history; a knowledge base rebuilt in the first sixty days; read access for the agent to customer configuration and usage data; an evaluation set of 300 real tickets with known-good answers that the agent must pass at 85% before launch and after every model or prompt change; a BAA-covered model endpoint, because tickets contain PHI; and a human escalation path staffed at all hours the product is used. This is a purchase, not a build.
Guardrails. No agent action on billing, refunds, or account closure without human approval. Any conversation mentioning a patient safety concern, a complaint about care, or a regulatory inquiry routes to a human immediately. The support lead and the transformation office review the fifty lowest-scored conversations every month.
3.2 Onboarding and implementation
Where the money is. Professional services is 5% of revenue and five people, and it is billed at a loss: implementations run six to ten weeks, most of the hours go to data migration and configuration, and the fee covers perhaps 60% of the cost. That is not unusual. KeyBanc's private SaaS survey put median professional services margins at about 26%, and Benchmarkit's 2025 benchmarks put the median at 30% with services running about 15% of revenue, so the composite is worse than median but on the same curve.13 Slow go-lives also delay revenue recognition and are the leading cause of early churn.
Target. Time to go-live from eight weeks to two; implementation cost per customer down 50%; professional services COGS from 5% to 3% of revenue. Implementation is repriced as part of the subscription tier rather than an hourly fee, which converts a loss-making service line into onboarding capacity for growth. This is principle 1 in its purest form: if the migration agent ships before the pricing change, the company has made a loss-making line cheaper to deliver and will keep billing it by the hour.
What the agents do. A data migration agent reads exports from the incumbent system (spreadsheets, PDFs, legacy databases), maps fields to the platform schema, flags conflicts, and produces a validated import with a human review of exceptions only; in home care this means client records, caregiver credentials, authorizations, and payer setups. A configuration agent interviews the customer about payers, states, service codes, pay rules, and workflows, then configures the tenant and produces a configuration summary for sign-off, replacing the workshops that consume the first two weeks of every project. Guided self-serve onboarding, with in-product checklists and an assistant that answers questions in context, lets smaller customers go live without a project manager at all. Training is generated from the customer's own configuration as short videos and walkthroughs, refreshed when features change. And a go-live readiness model predicts risk from configuration completeness, data quality, and user activation, so the remaining human implementers spend their time on the accounts that need them.
What the evidence says. This is the thinnest evidence base in the playbook, and the target is set accordingly. BuildOps, a field-service vertical software company, used Flatfile's machine-learning import tool in 2022 to "decrease its overall time to launch by an estimated 15%-20%" and record an "average 20%-25% decrease in per-project person hours," before large language models were available.14 WellSky's April 2026 launch of ambient documentation for personal care reports that "agencies report reducing care plan documentation time from up to three hours to approximately one hour per client."15 No vendor publishes a clean before-and-after on implementation cost per customer. We therefore run this chapter as an internal measurement program: baseline every implementation in the first ninety days, then run the migration and configuration agents on the next twenty and measure.
| Metric | Typical at close | Year 1 | Year 3 | P&L line |
|---|---|---|---|---|
| Time to go-live (median) | 8 weeks | 4 weeks | 2 weeks | Revenue timing, early churn |
| Implementation hours per customer | 90 | 55 | 35 | Professional services |
| Implementation cost recovery | 60% of cost | Bundled in tier | Bundled in tier | Revenue, PS COGS |
| Customers onboarded per implementer per month | 2 | 4 | 7 | Professional services |
| Professional services, % of revenue | 5% | 4% | 3% | Gross margin |
What it takes. A documented target schema and import API; a library of anonymized migration cases for testing; the pricing decision made before the agents launch; a purchased data-import platform for the file handling, with the mapping and validation logic built in-house because the schema is ours.
Guardrails. Every migrated record set is reconciled by count and by sample before go-live, with the customer signing off. Payer and authorization data is validated against source documents by a human. Migration agents operate only on BAA-covered endpoints because the data is PHI throughout.
3.3 Customer success, retention and expansion
Where the money is. Four customer success managers cover 450 accounts, which means most customers hear from the company at renewal and not before. Gross retention is 92%: 36 customers a year, about $800K of ARR, leave, most citing a missed expectation, an unresolved issue, or a change of staff at the customer. Net retention is barely above 100% because nobody is selling expansion.
Target. Gross retention from 92% to 94% or 95%, net retention from 101% to 108% or better, with success headcount rising from four to five while support headcount falls. Success becomes a revenue function measured on net retention.
What the agents do. The single most valuable agent in the function is the health-scoring model, because it directs the humans: a model over usage, support history, billing, sentiment from conversations, and champion changes, producing a weekly ranked list of at-risk and expansion-ready accounts with the reason for each. A renewal agent assembles, for every renewal ninety days out, the usage, the value delivered (claims processed, hours scheduled, denials avoided), open issues, and a recommended price and package, so the CSM walks in with a business case rather than a form. An expansion agent detects new locations, new payers, headcount growth at the customer, and feature usage that signals readiness for a higher tier, and drafts the outreach. A review agent generates the quarterly business review deck per account from live data. And a voice-of-customer agent synthesizes support conversations, reviews, and CSM notes into a weekly product and executive digest with quantified themes.
What the evidence says. Gainsight's case study for Aqua Security reports churn predicted "with 95% accuracy" and a renewal forecast margin of error falling "from 40% to under 5%."16 Vista Equity Partners reports ARR per customer success manager across a selected set of seventeen portfolio companies rising "from $5.4 million in 2023 to $6.4 million in 2024 and $6.7 million in 2025, a 25.2% increase," which supports the capacity assumption.17 What no vendor publishes is a retention delta attributable to AI health scoring, and the peer-reviewed literature is a warning against assuming one. Ascarza's field experiments found that the highest-risk customers "are not necessarily the best targets" for retention spending and that targeting by sensitivity to the intervention is "significantly more effective than the standard practice of targeting customers with the highest risk of churning."18 A health score tells you who is leaving. It does not tell you who can be kept, and the difference is the CSM's job.
The retention lift in our model therefore comes from three places: earlier intervention on at-risk accounts, faster onboarding (3.2), and AI product features customers do not want to lose (3.5).
| Metric | Typical at close | Year 1 | Year 3 | P&L line |
|---|---|---|---|---|
| Gross revenue retention | 92% | 93% | 94% to 95% | Revenue |
| Net revenue retention | 101% | 104% | 108% to 110% | Revenue |
| Renewal forecast accuracy (90 days out) | ±25% | ±10% | ±5% | Planning quality |
| Accounts per CSM with a quarterly review | 60 of 110 | 110 of 110 | 90 of 90 | Retention |
| ARR per CSM | $2.5M | $2.6M | $2.7M+ | Support and success |
What it takes. The warehouse with usage events, support history, billing, and CRM joined at the account level; a purchased CS platform with the health model either native or fed from the warehouse; a compensation plan that pays success on net retention; the pricing and packaging decisions from 3.4, so that expansion has something to sell.
Guardrails. Health scores are explanations, never verdicts: every score shows its drivers. Outreach drafted by agents is sent by people for the first year. Price recommendations at renewal are bounded by the pricing policy and reviewed for any account above $50K ACV.
3.4 Pricing, packaging and monetization
Where the money is. Pricing has not changed since 2021. The product is sold per user at a rate that, for a typical agency, is less than the cost of one part-time scheduler, while the software runs the agency's scheduling, compliance, and billing. This is the largest single lever in the plan and the only one competitors cannot copy by buying the same tools we use.
Target. A cumulative 6% price uplift on the installed base over three years through value-based tiers, with AI modules attached to the higher tiers, and implementation bundled into the subscription. Price flows to EBITDA at roughly 90% because delivery cost does not change.
What the agents do. A value-analysis agent computes, per account, the hours the platform saves, claims value processed, denials avoided, and compliance events handled, producing a value statement that anchors the renewal conversation and the tier recommendation. Tier design is analysis of feature usage across the base to build good-better-best packages in which AI capabilities (3.5) sit in the upper tiers, so that the increase is attached to visible new value rather than presented as an increase. Renewal uplift runs cohort by cohort, with agent-drafted communications, objection-handling playbooks, and a retention watch on every uplifted account for 120 days. Usage metering instruments the events (claims submitted, visits verified, documents processed) that will support consumption elements, so that part of pricing can move from per-user to per-outcome over time. And competitive research monitors competitor pricing pages, RFPs, and win-loss notes continuously.
What the evidence says. The pricing evidence is the strongest in the document because large vendors publish it. Salesforce announced that "on August 1, 2025, list prices will increase by an average of 6%" on Enterprise and Unlimited editions of its core clouds, alongside Agentforce add-ons "starting at $125 per user per month" and Agentforce 1 Editions "starting at $550 per user per month"; the same week, Slack's Business+ plan went "to $15 from $12.50 per user per month," a 20% increase.19 Zylo's 2026 index of more than 40 million licenses found the average organization's SaaS spend rose nearly 8% in 2025 to $55.7M while the average portfolio held steady at 305 applications.20 The KeyBanc and Sapphire 2025 private SaaS survey found that "more than two-thirds (67%) of companies are already monetizing AI ... with companies tending to favor a subscription model over usage-based and hybrid models."21 Vista reports that Sonatype customers migrated to scan-based pricing showed "a 40% ARR increase, 80% longer contracts, and no change in renewal or win rates."17
Against that, buyers now scrutinize per-seat models for AI exposure. a16z's argument is the one operating partners hear in diligence: "If AI can handle a sizable proportion of customer support, companies will need far fewer human support agents, and therefore fewer Zendesk software seats."22 Growth Unhinged's May 2026 survey of more than 230 B2B software companies found hybrid pricing rising from 25% to 37% of respondents in twelve months.23 That is why the plan meters usage from the first hundred days rather than raising seat prices alone.
| Metric | Typical at close | Year 1 | Year 3 | P&L line |
|---|---|---|---|---|
| Price realization on renewals (year over year) | 0% | +3% | +2% (cumulative +6%) | Revenue |
| Share of base on new tiers | 0% | 40% | 90% | Revenue |
| Attach rate of paid AI modules | 0% | 15% | 45% | Revenue |
| Churn among uplifted accounts vs control | n/a | No worse | No worse | Retention |
| Share of revenue with a usage component | 0% | 5% | 20% | Valuation (AI resilience) |
What it takes. Usage instrumentation in the first hundred days; the value model per account; a pricing council (CEO, CFO, head of success, head of product) that meets monthly; the first AI module ready to ship before the first uplift cohort renews.
Guardrails. No uplift above 10% in a single renewal without executive approval. Uplifts are sequenced behind delivered value, never ahead of it. Every uplift cohort has a control cohort so the retention effect is measured, and the program pauses if churn in the uplifted cohort exceeds the control by more than one point.
3.5 Product: AI capabilities customers pay for
Where the money is. This chapter is the Invent horizon and the source of most of the revenue growth. The customer is a care provider whose staff spend their days on intake calls, filling shifts, chasing authorizations, writing visit documentation, and working denied claims. Each of those is a measurable hours-per-week problem that the platform already holds the data to solve.
Target. Three paid AI modules shipped within eighteen months, attached to 45% of the base by year three, contributing about $1.2M of ARR in expansion plus the retention effect of features customers depend on. The first ships inside twelve months of close.
What the modules do. Ambient and assisted documentation drafts visit notes, care plans, and assessments from voice and structured data, for review and signature by the clinician or caregiver. Authorization tracking watches balances and expirations, assembles renewal requests, and submits through payer portals where allowed; in home care an expiring authorization is lost revenue for the agency, so this module sells itself. Claims scrubbing, denial prediction, and appeals run pre-submission checks against payer rules, predict likely denials, and draft appeal packages. Scheduling and shift filling recommend caregiver-to-visit matches on skills, credentials, location, continuity, and preference, with automated outreach to fill open shifts. Intake and eligibility capture referrals by voice and web, check eligibility and benefits, and create the client record. Compliance monitoring runs continuous checks on caregiver credentials, training, EVV compliance, and state documentation rules, with alerts before a survey finds the gap. Agency intelligence is natural-language reporting over the agency's own data: margin by payer, utilization by caregiver, referral-source performance, cash forecast.
What the evidence says. The evidence is strongest for documentation and revenue cycle, where independent studies and large vendors have published results, and weakest for scheduling and intake, where vendors have announced features without outcomes. The sober number for documentation is the multisite JAMA study of 1,809 clinicians who adopted AI scribes across five academic systems: adoption "was associated with 13.4 (95% CI, 9.1-17.7) fewer minutes of EHR time, 16.0 (95% CI, 13.7-18.3) fewer minutes of documentation time, and 0.49 (95% CI, 0.17-0.81) additional weekly visits delivered" per eight scheduled hours, and "electronic health record time outside work hours did not change significantly."24 Sutter Health's hundred-clinician study with Abridge found "mean time in notes per appointment decreased from 6.2 to 5.3 minutes."25 Microsoft says clinicians using Dragon Copilot report "five minutes saved per encounter."26 Sixteen minutes per eight hours is what to promise; five minutes per encounter is what a vendor's customers say.
Revenue cycle is where the agency feels it. Availity says 80% of prior-authorization requests through its Intelligent Utilization Management product are "touchless," returned "without the need for manual processing by staff at either the provider or the payer."27 Waystar reports appeal-package creation "more than 90% faster—cutting time from 38 hours to two" and early adopters "overturning 40% more denials."28 Experian's 2025 State of Claims survey found "41 percent of providers now face denial rates of 10 percent or higher, an issue that has grown each year since the first survey in 2022."29 For an agency, a two-point improvement in first-pass acceptance is worth more than the software subscription.
On pricing: ambient documentation sells at list prices from about $119 per clinician per month at the low end to $600 per month for Microsoft's DAX Copilot, with Abridge reported at roughly $2,500 per clinician per year,30 which says a home care agency will pay a meaningful premium for a bundle that saves scheduler and biller hours. Module prices are set from measured hours saved at design-partner agencies, at 25% to 35% of the labor value delivered.
| Metric | Typical at close | Year 1 | Year 3 | P&L line |
|---|---|---|---|---|
| Paid AI modules in market | 0 | 1 | 3 | Revenue |
| Module attach rate | 0% | 15% | 45% | Revenue |
| Expansion ARR from modules | $0 | $0.3M | $1.2M | Revenue |
| Measured customer hours saved per week (median agency) | 0 | 8 | 25 | Pricing power, retention |
| Share of R&D capacity on AI modules | 0% | 35% | 40% | R&D mix |
What it takes. Two or three design-partner agencies with a data-sharing agreement and a measurement protocol; a product manager who owns hours-saved as the metric; the BAA-covered model stack and evaluation harness from Section 7; a build-or-partner decision for each module (documentation and denials have strong third-party engines to license; scheduling and intake are built on our own data).
Guardrails. Clinical documentation is always reviewed and signed by a licensed or authorized person. Anything that influences a medical-necessity or coverage decision falls under the Section 1557 nondiscrimination duties and the state human-review laws in Section 8. AI-generated communications to patients carry the disclosures California and Texas require. Every module ships with an evaluation set, a bias review, and a rollback plan.
3.6 Engineering and product development
Where the money is. R&D is 23% of revenue and 18 people, producing two or three meaningful releases a year from a twelve-year-old codebase. Roughly 40% of engineering time goes to maintenance, defect fixing, and manual QA. The company needs more product than this team ships, at lower cost, and this chapter has to deliver both.
Target. R&D from 23% to 18% of revenue while shipping three times the feature volume, including the modules in 3.5. Headcount from 18 to 15 through attrition and a change in mix toward senior engineers who direct agents, with two forward-deployed engineers added to the transformation office.
What the agents do. Agentic coding tools run on every task (feature work, bug fixes, refactors, migrations) with human review as the binding constraint; adoption is mandated and measured, and the engineering leader owns the review-capacity plan. Test generation brings coverage on legacy modules from near zero to a defensible level and runs regression on every change, so manual QA moves from executing scripts to designing them. Legacy modernization (language and framework upgrades, dependency updates, module rewrites) runs by agent with engineer supervision. A review agent does first-pass review on every pull request for defects, security issues, and standards, so human review focuses on design. Documentation agents generate and maintain architecture docs, API references, and runbooks from the code, which also feeds the support and onboarding agents. Triage agents deduplicate, classify, and route incoming defects with a proposed fix. And a discovery agent synthesizes support conversations, usage data, and customer interviews into ranked opportunity briefs.
What the evidence says. Task-level evidence is mixed and the honest reading is that it depends on who is measured. METR's randomized trial of sixteen experienced open-source developers on their own repositories found they "take 19% longer to complete issues" with AI tools, while having "expected AI to speed them up by 24%" and still believing afterwards that "AI had sped them up by 20%."31 METR's February 2026 follow-up estimated a speedup of 18% for the ten developers who returned, with a confidence interval from 38% faster to 9% slower, and then said the estimate is "likely a bad proxy" and abandoned the design for selection bias, so I treat it as a direction rather than a number.31 The largest field experiment, Cui and colleagues' randomized rollout of a coding assistant to 4,867 developers at Microsoft, Accenture, and a Fortune 100 company, found "26.08% (SE: 10.3%)" more completed tasks.32
The evidence that matters most for a PE owner is what happens downstream of the code. Faros AI's 2026 study of 22,000 developers across 4,000 teams found task throughput up 33.7% and PR merge rate up 16.2%, alongside 54% more bugs per developer, a fivefold increase in median review time, and 242.7% more incidents per pull request.33 Google's 2025 DORA report, from about 5,000 respondents, observed "a positive relationship between AI adoption on both software delivery throughput and product performance," while "AI adoption does continue to have a negative relationship with software delivery stability."34 The lesson is that review and QA capacity determine the gain far more than code generation does, which is why test generation and review agents are deployed before coding agents are scaled.
Company-level evidence is clearer than task-level. High Alpha's 2025 benchmarks found 69% of software companies between $5M and $20M of ARR had reduced headcount because of AI, and that "engineering headcount reductions due to AI are significantly higher than any other department," at 42% of companies against 27% for support and success.35 Vista reports R&D expense across 54 selected portfolio companies falling "from 21.9% in 2023 to 20.1% in 2024 and 19.2% in 2025."17 For the modernization lever specifically, Amazon's CEO said its Java-upgrade agent "saved us the equivalent of 4,500 developer-years of work" and "an estimated $260M in annualized efficiency gains," an internal estimate on a scale no $10M company will see, but the mechanism transfers.36
| Metric | Typical at close | Year 1 | Year 3 | P&L line |
|---|---|---|---|---|
| Meaningful releases per year | 3 | 6 | 10 | Revenue (indirect) |
| Automated test coverage on core modules | 15% | 50% | 75% | Quality, R&D |
| Change failure rate | 18% | 12% | 8% | Support, retention |
| Engineering hours on maintenance | 40% | 30% | 20% | R&D |
| R&D, % of revenue | 23% | 21% | 18% | EBITDA |
| R&D headcount | 18 | 17 | 15 | R&D |
What it takes. Modern source control and CI with the test harness in place; an agentic coding platform with enterprise controls and, for any code touching PHI in test data, a BAA; a review-capacity plan; a QA discipline that treats agent-written code as untrusted; engineering leadership that will hold the line on quality metrics while velocity rises.
Guardrails. No agent merges to production. Change failure rate and incident counts are tracked weekly, and a rise above baseline pauses the expansion of agent scope. Security scanning is mandatory on agent-written code. Test data is synthetic or de-identified.
3.7 Infrastructure, IT and security operations
Where the money is. Hosting and platform run at 7% of revenue with little optimization, and three people cover IT, security, DevOps, and the SOC 2 and HIPAA programs by hand. Incidents are handled by whoever is awake.
Target. Hosting and platform from 7% to 6% of revenue despite 35% revenue growth; incident response time down by half; compliance evidence collection 80% automated; IT and security headcount from three to two with on-call load reduced.
What the agents do. FinOps, which the FinOps Foundation defines as "an operational framework and cultural practice which maximizes the business value of technology ... through collaboration between engineering, finance, and business teams,"37 is run by agents doing continuous rightsizing, reserved-capacity purchasing, idle-resource cleanup, and workload scheduling. Incident agents correlate alerts, reduce noise, propose root causes, execute runbooks, and draft post-incident reports. A purchased compliance platform does continuous control monitoring and evidence collection for SOC 2 and HIPAA. Security agents triage alerts, analyze phishing, run access reviews, and prioritize vulnerabilities. And a helpdesk agent handles provisioning, deprovisioning, and access requests with approval workflows.
What the evidence says. Cloud waste is real and measured: Flexera's 2026 survey of more than 750 cloud decision-makers found wasted infrastructure and platform spend rose to 29%, the first increase in five years, driven by AI workloads.38 Cast AI's Akamai case study quotes savings "falling between 40-70%, depending on the workload," which is a per-workload figure, not a total-bill one; we plan on 15% to 25% of the hosting bill.39 For incidents, SolarWinds' 2025 analysis of more than 60,000 ITSM records found generative AI users resolving tickets 17.8% faster on average, with the top adopters cutting resolution time 54.3%.40 Vista cites LogicMonitor's agent delivering "60%+ reduction in response time ... 85% reduction in alert noise" in its own portfolio.17 Microsoft's observational study of 95,522 security incidents across matched organizations found generative AI adoption "associated with a 30.13% reduction in security incident mean time to resolution," and its earlier randomized trials found professionals "22% faster" and "7% more accurate" with its security copilot.41 Compliance automation evidence is weaker than it looks: Vanta's claim of "automating 85% of evidence collection" carries no citation, and its 82% audit-time figure comes from a Vanta-sponsored IDC study across industries.42 The direction is right; the numbers are marketing.
All of these are Deploy-horizon purchases, not builds.
| Metric | Typical at close | Year 1 | Year 3 | P&L line |
|---|---|---|---|---|
| Hosting cost per $1 of revenue | 5.0 cents | 4.7 cents | 4.5 cents | Hosting |
| Mean time to resolve incidents | 4 hours | 2.5 hours | 2 hours | Retention, R&D |
| Compliance evidence collected automatically | 10% | 70% | 85% | G&A, sales cycle |
| IT, security, DevOps headcount | 3 | 3 | 2 | Hosting and platform, G&A |
What it takes. Tagging and cost allocation across cloud accounts; centralized logging and observability; a compliance platform connected to the cloud, identity, HR, and device systems; documented runbooks that agents can execute.
Guardrails. Agents do not change production infrastructure without an approval step until six months of clean operation. Cost optimizations are validated against performance and availability targets. Compliance automation does not replace the annual risk analysis that HIPAA requires and that OCR's enforcement actions have centered on; it feeds it.
3.8 Sales
Where the money is. Sales is 9% of revenue and eight people: a founder who closes the largest deals, four account executives, two SDRs, and a sales operations person. Pipeline comes from referrals and trade shows; outbound is sporadic; CRM data is incomplete; proposals take days. New-logo growth is 5% to 6% a year.
Target. Sales spend rises to 10% of revenue in absolute terms as the growth engine is built, while pipeline per representative doubles and cost per qualified meeting falls by half. Founder dependence is removed within eighteen months.
What the agents do. Research agents assemble the universe of agencies by state, payer mix, size, licensure, and technology signals, enrich contacts, and maintain the list continuously. Outbound runs as agent-drafted, human-approved sequences personalized from that research, with an AI SDR handling first replies and booking. Call intelligence records, summarizes, and writes every call back to the CRM with next steps, contacts, and risks. Proposal, security questionnaire, and RFP drafts are assembled from the knowledge base and prior responses in minutes, with compliance evidence from 3.7 attached. Prospect-specific demo tenants are seeded with realistic data for the prospect's payer mix and state, and an ROI model is populated from the value analysis in 3.4. Forecasting scores pipeline on engagement and stage evidence, with weekly deal reviews prepared by agent.
What the evidence says. Vendor results are plentiful and independent evidence is thin. Clay's A-LIGN case study reports an "83% reduction in research costs" and "$6.8M in total pipeline generated or identified ($4.2M created, $2.6M tagged)."43 Artisan publishes a cost per lead of $52 at SumUp and about $45 at CookUnity, from its own blog.44 Momentum quotes Ramp's head of GTM systems saying the tool "has cut the time in half for sellers to progress their deals in Salesforce," and titles its ScyllaDB study with a 30% rep-productivity gain.45 Gong's analysis of 7.1 million opportunities found that teams that "deeply leverage AI generate 77% more revenue per representative," a correlation from the company that sells the AI.46
Two things temper this. The cold-email benchmarks that AI SDR vendors quote are not what large samples show: Hunter's 2026 report on 31 million emails puts the average sequence reply rate at 4.5%, and in two 2026 head-to-head tests fully AI-written emails earned about 1.4% positive replies against 2% to 4% for human-written ones, with human-edited AI drafts doing best.47 And the 11x episode in March 2025, when TechCrunch found the AI SDR vendor displaying customers it did not have (ZoomInfo: "we are not a customer"), is the reason this chapter measures meetings held and pipeline created rather than vendor-reported activity.48 Vista's portfolio sales and marketing spend falling "from 30.4% in 2023 to 27.6% in 2024 and 25.6% in 2025" across 55 selected companies is the best available evidence that the function can grow output faster than cost.17
| Metric | Typical at close | Year 1 | Year 3 | P&L line |
|---|---|---|---|---|
| Qualified meetings per month | 25 | 45 | 70 | Revenue |
| Cost per qualified meeting | $900 | $550 | $400 | Sales |
| Pipeline per AE per quarter | $400K | $650K | $900K | Revenue |
| New-logo ARR per year | $0.6M | $0.9M | $1.5M | Revenue |
| CRM data completeness on open deals | 55% | 90% | 95% | Forecast quality |
| Share of new ARR closed without the founder | 40% | 75% | 100% | Key-person risk |
What it takes. A clean CRM with defined stages; a research and enrichment platform; a conversation-intelligence tool; the ideal customer profile and messaging refreshed from win-loss analysis; a compensation plan that rewards AE productivity rather than headcount.
Guardrails. All outbound is human-approved for the first two quarters, and volume per domain is capped to protect deliverability. No claims about clinical outcomes in sales copy without evidence. Healthcare buyers are sensitive to automation, so every sequence discloses that scheduling is assisted and every meeting is with a person.
3.9 Marketing and demand generation
Where the money is. Marketing is 5% of revenue and three people, spent mostly on events. The company has almost no organic presence and no repeatable inbound channel, which means every new customer costs a trade show or a referral.
Target. Marketing rises to 6% of revenue in absolute terms, with cost per qualified lead down 40% and inbound contributing a third of pipeline by year three. The team stays at three people and its output triples.
What the agents do. A content engine produces regulatory explainers, state-by-state guides, payer updates, and product education weekly, with agent drafting and expert review; in a regulated vertical this content is also what the support and sales agents cite. Content is structured for AI answer engines as much as for classic search, and the metric is qualified inbound, never sessions. Every event is turned into follow-up sequences, clips, summaries, and nurture content within 48 hours. Per-account briefs for the top 200 target agencies are refreshed continuously and shared with sales. Case studies, value statements, and reference programs are generated from the per-account value analysis in 3.4. And competitor releases, pricing, reviews, and hiring are monitored and summarized weekly.
What the evidence says. Jasper publishes named productivity results: WalkMe reports "3,000+ hours saved in content creation time," and Akbank a "40% reduction in time spent creating content."49 Against that, the search channel is shrinking under the content. Ahrefs' February 2026 update across 300,000 keywords found "the presence of AI Overviews now reduces the click-through rate for position 1 by ~58%," up from 34.5% a year earlier, which it summarizes as "for every 100 clicks you could historically earn for a top-ranking page, Google now 'keeps' 58."50 SparkToro's 2026 clickstream analysis found US Google searches "ended without a click 68.01% of the time" in the first four months of the year.51 That is why the plan treats content as fuel for agents and for account-based motions rather than as a traffic strategy. No credible evidence exists for AI-driven cost-per-lead reduction in B2B; the 40% target is internal, measured against the events baseline.
| Metric | Typical at close | Year 1 | Year 3 | P&L line |
|---|---|---|---|---|
| Qualified inbound leads per month | 12 | 30 | 60 | Revenue |
| Cost per qualified lead | $1,400 | $1,000 | $850 | Marketing |
| Inbound share of pipeline | 10% | 20% | 33% | Revenue |
| Content pieces published per month | 2 | 12 | 20 | Marketing |
What it takes. A marketing automation platform connected to the CRM; a content operations workflow with subject-matter review; brand and claims guidelines the drafting agents enforce; attribution that tracks both first touch and influenced pipeline.
Guardrails. Regulatory content is reviewed by a qualified person before publication and dated. No generated testimonials or case studies; every customer quote is real and approved. Claims about savings or outcomes cite the measurement behind them.
3.10 Finance and accounting
Where the money is. Finance is four of the seven people in G&A: a controller, two accountants, and a billing specialist, plus outsourced tax. The close takes twelve days, collections are reactive, DSO is 55 days, and the board package is assembled by hand over a week each quarter. Forecasting is a spreadsheet the founder maintains. Against APQC's benchmarks, where top performers close in five days or less and the median is six, and where median DSO is 38 days with top performers at 30 or under, the composite is in the bottom quartile on both.52
Target. Close in four days, DSO from 55 to 38 days (releasing about $630K of cash at year-three revenue), AP and expenses 85% no-touch, and a rolling forecast the executive team trusts. Finance headcount from four to two, with the controller becoming a CFO-level operator supported by agents.
What the agents do. Close automation runs bank and payment reconciliations, accrual proposals, revenue-recognition schedules, flux analysis with explanations, and close checklists; the controller reviews exceptions. Collections agents confirm invoice delivery, send personalized reminders, capture disputes, propose payment plans, and escalate, with the human collector handling disputes and large accounts. Pre-billing checks reconcile usage, contract terms, and price changes, because inaccurate invoices are the leading cause of late payment in usage-influenced billing. AP agents capture, code, route, and schedule invoices and expenses. A driver-based FP&A model refreshes from the warehouse weekly, with scenario analysis on request and variance commentary drafted by agent. Board and investor packages are generated from the warehouse and the KPI tree in Section 9, with narrative drafted for the CEO to edit. Audit and tax requests are answered from a continuously maintained evidence library.
What the evidence says. Finance has the strongest independent evidence in the back office. Choi of MIT Sloan and Xie of Stanford GSB studied 79 small and medium companies on an AI-enabled accounting platform and found accountants using AI could cut 7.5 days off the monthly close, support 55% more clients per week, and shift 8.5% of their time from routine processing to higher-value work.53 Numeric's November 2025 announcement says Brex "saw their match rate jump from 30% to over 90%" on reconciliations.54 Tesorio's customer pages report Couchbase cutting DSO by ten days, Seismic by about 30%, and Discovery Education's K-12 segment DSO falling "from 128 days to 43 days" over a year.55 Vic.ai says clients "can achieve up to an 85% no-touch invoice rate" within six months, with its named case studies landing at 72% to 78%; Brex reports "over 65% of all expenses on Brex are fully automated" and that customers accept over 90% of its AI coding suggestions.56 Pigment's Supercell story is often quoted as "eight days to four minutes," and the customer's own words are that it "took 2 days for 4 people to update our large P&L spreadsheet," and afterwards "those same updates took me 4 minutes to complete," so eight person-days to four minutes.57 MIT NANDA also found that "some of the most dramatic cost savings we documented came from back-office automation," with faster payback than the sales and marketing programs that absorbed about 70% of budgets.1 Every lever here is a purchased tool configured by the controller.
| Metric | Typical at close | Year 1 | Year 3 | P&L line |
|---|---|---|---|---|
| Days to close | 12 | 6 | 4 | G&A |
| DSO | 55 days | 45 days | 38 days | Working capital |
| Invoices requiring manual correction | 8% | 3% | 1% | G&A, DSO |
| AP and expense no-touch rate | 10% | 70% | 85% | G&A |
| Forecast error (quarterly revenue) | ±8% | ±4% | ±2% | Planning quality |
| Finance headcount | 4 | 3 | 2 | G&A |
What it takes. A modern general ledger and billing system (replace anything that cannot integrate); the warehouse as the single source for revenue and usage; close, AR, and AP platforms purchased and connected; a controller willing to redesign the function around exceptions.
Guardrails. Segregation of duties is preserved: agents propose, humans approve payments and journal entries above thresholds. Collections communications are reviewed for tone and are never sent to accounts with open service disputes. Revenue-recognition logic is reviewed by the auditor before it runs unattended.
3.11 People and HR
Where the money is. HR is one generalist inside G&A, supported by the office manager and outsourced payroll. Recruiting is done by hiring managers with an agency for senior roles. Onboarding and policy questions consume manager time across the company.
Target. HR stays at one person while the company changes shape, with recruiting cycle time halved, an employee helpdesk that answers most questions itself, and a structured redeployment program that moves people from automated work to growth work.
What the agents do. Recruiting agents write job descriptions, source, screen against structured criteria, schedule interviews, and produce structured interview summaries. A helpdesk agent answers policy, benefits, payroll, and IT questions from the handbook and systems. Onboarding agents build role-specific plans and training paths, including the AI-skills curriculum every employee completes in the first ninety days. Performance agents draft review summaries from goals and evidence and map skills for redeployment decisions. And the headcount model in Section 4 is maintained live against attrition, hiring, and the agent register, so every role change is planned.
What the evidence says. Recruiting and helpdesk automation have named vendor results; performance and onboarding do not. Paradox's 7-Eleven case study reports time to hire falling from "over 10 days in most cases" to "under 5 days" in high-volume store hiring; knowledge-worker evidence is thinner, and we target a 30% to 50% cycle-time reduction.58 Moveworks reports Databricks' employee assistant climbing from 10% adoption at launch to 73%, "with about half of inquiries handled entirely by the bot"; at our scale a lighter tool inside the existing HR platform is the right purchase.59 The larger value in this chapter is organizational: the redeployment program and the skills curriculum are what make the headcount plan humane and achievable.
| Metric | Typical at close | Year 1 | Year 3 | P&L line |
|---|---|---|---|---|
| Time to hire (days) | 55 | 35 | 28 | G&A, growth |
| Employee questions answered without HR | 0% | 50% | 70% | G&A, manager time |
| Employees through the AI-skills curriculum | 0% | 100% | 100% (annual refresh) | Adoption |
| Roles redeployed vs eliminated | n/a | 2 redeployed, 1 eliminated | 5 redeployed, 8 eliminated | All cost lines |
| Voluntary regretted attrition | 12% | 10% | 8% | R&D, retention |
What it takes. An HR platform with helpdesk and workflow capability; an applicant tracking system; a written redeployment policy and retention plan for the people whose roles change; manager training on leading teams that include agents.
Guardrails. AI screening uses structured criteria, is audited for adverse impact quarterly, and never makes a hiring decision. Employees are told what is automated and how their roles change, in advance, by their manager. Compensation and performance data does not enter any model without a data processing agreement of BAA-equivalent strength.
3.12 Legal, compliance and risk
Where the money is. Legal is outside counsel at roughly $150K a year, mostly for customer contracts, vendor agreements, and the occasional payer or state inquiry. Compliance is the HIPAA and SOC 2 programs run by the IT lead, and the regulatory monitoring that product and support do informally.
Target. Outside counsel spend down 40%, contract turnaround from two weeks to three days, compliance programs continuously evidenced, and a formal regulatory monitoring function that also becomes customer-facing product (3.5).
What the agents do. First-pass review and redlining of customer, vendor, and partner agreements against the company playbook. Extraction of every executed agreement into a searchable database of terms, renewal dates, price escalators, and obligations, which feeds renewals (3.3) and pricing (3.4). Continuous tracking of state and federal changes affecting home care, EVV, Medicaid billing, and AI in healthcare, summarized and routed to product and customers. Security questionnaires answered from the compliance evidence library (3.7). And policies drafted, versioned, and attested through the compliance platform; the AI use policy itself lives here.
What the evidence says. Contract review has strong vendor evidence at enterprise scale. Harvey reports "up to 8 hours saved per lawyer per week on routine work" at Adecco, "4–6 hours saved per lawyer per week" at Repsol, and "up to 5 hours per lawyer per week" at Deutsche Telekom.60 Ironclad reports Poshmark "cutting their contract turnaround times down by 96%" and Hormel taking contracting "from 12 weeks down to consistently 3 weeks."61 At our scale the gain is measured in counsel invoices and days of turnaround. Regulatory monitoring evidence is our own operating experience rather than a published benchmark.
| Metric | Typical at close | Year 1 | Year 3 | P&L line |
|---|---|---|---|---|
| Outside counsel spend | $150K | $110K | $90K | G&A |
| Contract turnaround (standard paper) | 14 days | 5 days | 3 days | Sales cycle, G&A |
| Agreements in a structured database | 0% | 100% | 100% | Renewals, pricing |
| Security questionnaire turnaround | 10 days | 2 days | 1 day | Sales cycle |
What it takes. A contract lifecycle platform with AI review; a written legal playbook of fallback positions and non-negotiables; the compliance platform from 3.7; a named owner for regulatory monitoring.
Guardrails. Non-standard terms, indemnities, liability caps, and anything touching PHI handling go to counsel. AI review output is privileged work product only when counsel directs it, and the workflow is designed with counsel to preserve that.
3.13 The executive operating system
Where the money is. The executive team's time is the scarcest resource in the plan. In the illustrative company it is spent assembling information rather than acting on it: the weekly numbers take a day to prepare, the board package a week, and most decisions wait for a meeting.
Target. A weekly business review generated from the warehouse every Monday morning, a live KPI tree, decisions logged and tracked, and the transformation office reporting value against the plan monthly.
What the agents do. The weekly review (metrics, variances, and the drivers behind them) is drafted by agent from the warehouse, with commentary for each function lead to edit before the meeting. Meeting notes are captured, decisions logged with owners and dates, and follow-through checked automatically. The register of every production agent, with its owner, scope, evaluation status, cost, and measured value, is maintained by the transformation office and reviewed monthly. The FP&A model from 3.10 is exposed to the executive team for natural-language questions. And the voice-of-customer and competitive digests from 3.3 and 3.9 arrive as one weekly briefing.
This chapter is operating practice rather than benchmarked technology. Its purpose is to make the rest of the playbook visible and accountable.
| Metric | Typical at close | Year 1 | Year 3 | P&L line |
|---|---|---|---|---|
| Hours to produce the weekly business review | 8 | 1 | 0.5 | G&A, executive time |
| Hours to produce the board package | 40 | 10 | 4 | G&A |
| Initiatives with measured value vs plan | n/a | 100% | 100% | Value tracking |
| Agents in the register with passing evaluations | n/a | 100% | 100% | Risk |
What it takes. The warehouse and KPI tree (Sections 7 and 9); a transformation office of three (Section 6); a meeting cadence the CEO enforces.
Guardrails. Numbers in the weekly review reconcile to the general ledger and the billing system; no metric appears without a defined source and owner.
4. The bridge: P&L, headcount and cash
The targets in Section 3 assemble into the following three-year bridge. Revenue grows from $10.0M to $13.55M (10%, 11%, 11%) through price realization, retention, expansion from AI modules, and new logos. EBITDA margin moves from 25% to 41%, and EBITDA from $2.5M to $5.6M. Sales and marketing rise in absolute dollars as growth investment; every other cost line falls in absolute dollars or holds flat while revenue grows a third.
Revenue bridge
| Component | $M | Source of the gain |
|---|---|---|
| ARR at close | 10.00 | |
| Price realization and packaging (3.4) | +0.70 | 6% cumulative uplift on the retained base, flowing through at ~90% |
| Improved retention (3.1 to 3.3, 3.5) | +0.40 | Gross retention from 92% to 94.5%; about 11 fewer lost customers a year by year 3 |
| AI module expansion (3.5) | +1.20 | Three modules, 45% attach, ~$6K average module ACV |
| New logos (3.8, 3.9) | +1.25 | New-logo ARR from $0.6M to $1.5M a year, net of ramp |
| ARR at end of year 3 | 13.55 |
P&L bridge
| Line | Close % | Close $M | Year 3 % | Year 3 $M | Margin pts | Lever |
|---|---|---|---|---|---|---|
| Revenue | 100% | 10.00 | 100% | 13.55 | 3.4, 3.5, 3.8, 3.9 | |
| Hosting | 5.0% | 0.50 | 4.5% | 0.61 | +0.5 | FinOps (3.7) |
| DevOps and platform | 2.0% | 0.20 | 1.5% | 0.20 | +0.5 | Automation (3.7) |
| Other COGS | 1.0% | 0.10 | 1.0% | 0.14 | 0 | |
| Support and success | 10.0% | 1.00 | 5.0% | 0.68 | +5.0 | Agent-first support (3.1, 3.3) |
| Professional services | 5.0% | 0.50 | 3.0% | 0.41 | +2.0 | Migration and onboarding agents (3.2) |
| Gross margin | 77.0% | 7.70 | 85.0% | 11.52 | +8.0 | |
| Sales | 9.0% | 0.90 | 10.0% | 1.36 | -1.0 | Growth investment (3.8) |
| Marketing | 5.0% | 0.50 | 6.0% | 0.81 | -1.0 | Growth investment (3.9) |
| R&D | 23.0% | 2.30 | 18.0% | 2.44 | +5.0 | Coding agents, QA, modernization (3.6) |
| G&A | 15.0% | 1.50 | 10.0% | 1.36 | +5.0 | Finance, HR, legal, compliance (3.10 to 3.12) |
| EBITDA | 25.0% | 2.50 | 41.0% | 5.56 | +16.0 |
Sixteen points of margin, of which eight come from gross margin and eight from operating expenses net of the two points reinvested in growth. The price lever appears in the revenue line rather than as a separate margin item; without it, year-three revenue would be about $12.85M and EBITDA margin about 38%. The bridge assumes no multiple expansion, no acquisition, and no reduction in hosting unit costs from vendors.
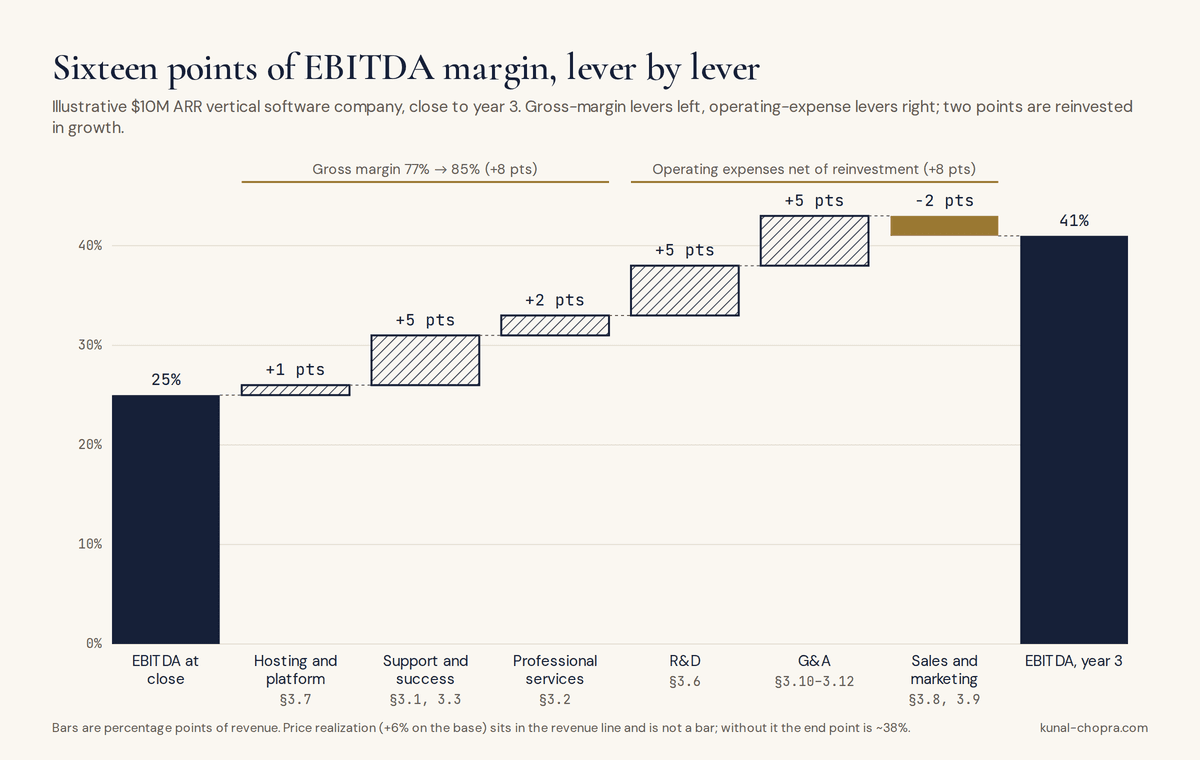
Headcount plan. Headcount moves from 60 to 52 while revenue grows 35%, taking ARR per employee from $167K to $260K. Thirteen positions in automated work are removed over three years; five of the people concerned are redeployed into success, sales, and the transformation office, and eight positions are eliminated through attrition. No reduction is planned in the first two quarters, when retention through the ownership transition matters most.
| Function | At close | Year 3 | Change | How |
|---|---|---|---|---|
| Support | 8 | 4 | -4 | Attrition and redeployment to success |
| Implementation | 5 | 3 | -2 | Migration and configuration agents; repriced offering |
| Customer success | 4 | 5 | +1 | Redeployed from support; success owns net retention |
| Product and engineering | 18 | 15 | -3 | Attrition; mix shifts senior; agents on every task |
| Sales | 8 | 9 | +1 | One AE added as the founder steps back; SDR work largely automated |
| Marketing | 3 | 3 | 0 | Output triples on the same team |
| Finance, HR, admin | 7 | 4 | -3 | Close, AR, AP, helpdesk automation; controller becomes finance lead |
| IT, security, DevOps | 3 | 2 | -1 | FinOps, incident, and compliance automation |
| Executive | 4 | 4 | 0 | |
| Transformation office | 0 | 3 | +3 | Transformation lead, two forward-deployed engineers |
| Total | 60 | 52 | -8 | ARR per employee $167K to $260K |
Cash and balance sheet. DSO falling from 55 to 38 days releases roughly $630K of working capital at year-three revenue. Implementation bundled into the subscription, and go-lives shortened from eight weeks to two, pull revenue recognition forward by an average of six weeks per new customer. Capital spending on the transformation is modest: tooling and platform subscriptions of roughly $350K a year at maturity, the transformation office at roughly $600K a year, and one-time data and migration work of $250K in year one, all included in the R&D and G&A lines above.
What this is worth. At close the company is a $10M ARR, 25% margin, 9% growth business. Private SaaS multiples have compressed hard: Aventis puts the median at 3.1x revenue in the first quarter of 2026 against a 2015-to-2026 median of 4.5x, and practitioner tables put sub-15%-growth companies at two to three times ARR.62 Bain's 2026 global report explains the pressure on the other side of the ledger: where a typical buyout once "required just 5% annual growth in earnings before interest, taxes, depreciation, and amortization (EBITDA) to generate a target 2.5x multiple on invested capital (MOIC) over a five-year holding period," today's entry prices "only pencil out if you assume much larger increases in EBITDA—something closer to 10%–12%," with rising multiples having "powered over 50% of all buyout returns" in the prior cycle and no longer available.63 This bridge compounds EBITDA at roughly 30% a year for three years, which is the kind of number the new math requires.
At year three it is a $13.55M ARR, 41% margin, 11% growth business with 45% of customers on paid AI modules, a usage-based revenue component, and 94% to 95% gross retention. Bessemer's formulation of the Rule of 40 is that "the sum of revenue growth and profit margin should equal 40%+," and top-decile cloud companies trade at around 48;64 this company would score 52, with the product-embedded AI that McKinsey's data says is what earns a multiple premium.4 Without any change in market multiples the EBITDA more than doubles. With the expansion that margin, retention, and AI attach typically earn, the enterprise value roughly triples. I would underwrite the first and treat the second as upside.
5. Sequencing
The order matters more than the list. Foundation before agents, pricing before automation, customer-facing product inside the first year, headcount changes after retention is secured.
Days 1 to 100: foundation and first proof. In weeks one to four, baseline every metric in Section 3 from actual data, stand up the transformation office, inventory systems and data, sign BAAs with model providers, select the agent platforms for support, finance, and engineering, publish the AI use policy, and announce the plan to the company with the redeployment commitment in writing. In weeks five to eight, bring the warehouse live with billing, CRM, usage, and support joined at the account level; rebuild the knowledge base; put coding agents and test generation live for engineering with the review-capacity plan; configure close automation and AR agents; ship the usage instrumentation for pricing. In weeks nine to fourteen, put the support agent live on chat and email with the evaluation harness; FinOps and compliance automation live; form the pricing council and start tier design; put the first design-partner agency on the first module's measurement protocol; generate the weekly business review automatically. At the day-100 review every initiative shows a baseline and a first measurement, and three numbers must have moved: support resolution, close days, and engineering test coverage.
Days 100 to 365: reshape. Quarter two: migration and configuration agents on every new implementation; health scoring live and success compensated on net retention; the outbound engine live with human approval; the contract lifecycle platform live; the first module in beta at design partners. Quarter three: new pricing tiers announced; the first renewal cohort uplifted against a control group; implementation bundled into tiers for new customers; the voice support agent in pilot; the modernization program underway; the first module generally available and attached to upper tiers. Quarter four: support at 40% agent resolution; finance closing in six days; DSO at 45; the first role changes through attrition; the year-one value review against the bridge; the second and third modules scoped from measured hours saved.
Years two and three: compound and invent. Modules two and three ship. Usage-based pricing elements are introduced for new customers. Support and success merge into one customer team. Finance runs on two people. Engineering ships ten releases a year. Headcount reaches the year-three plan through attrition and redeployment. Any services add-on acquisition is evaluated against the platform the company has by then become.
6. Operating model and governance
The transformation office. Three people, reporting to the CEO with a dotted line to the chairman: a transformation lead who owns the value plan and the agent register, and two forward-deployed engineers who build, integrate, and evaluate agents alongside the function leads. The model is the one the larger sponsors have started to formalize; Thoma Bravo's April 2026 arrangement with Google Cloud gives its portfolio "teams of Google forward deployed engineers to rapidly solve deep technical challenges" rather than a central team that takes requests.65 The office owns no P&L line; the function leads do. The office owns the measurement.
Cadence. Weekly: the business review generated Monday, a thirty-minute executive meeting on variances and decisions, and a transformation-office stand-up with function leads on live initiatives. Monthly: the value review, where every initiative is judged against its baseline and target and kill decisions are taken; the agent register review of evaluations, incidents, cost, and scope changes; and the pricing council. Quarterly: board reporting on the bridge; a risk and compliance committee (CEO, finance lead, IT and security lead, outside counsel as needed) on AI incidents, regulatory changes, and the risk analysis; and the redeployment and headcount plan review.
Ownership.
| Area | Owner | Accountable for |
|---|---|---|
| Value plan and bridge | CEO, with the transformation lead | Delivery of the P&L bridge |
| Pricing and packaging | CEO, pricing council | Price realization, attach, uplift retention |
| Product modules | Head of product | Hours saved per customer, module ARR |
| Support and success | Head of customer | Cost per ticket, resolution rate, gross and net retention |
| Engineering levers | Head of engineering | Releases, coverage, change failure rate, R&D ratio |
| Finance, legal, HR levers | Finance lead | Close, DSO, no-touch rates, G&A ratio |
| Infrastructure and security | IT and security lead | Hosting ratio, incident metrics, compliance evidence |
| Sales and marketing engine | Head of revenue | Meetings, pipeline, cost per meeting and lead |
| Agent register and evaluations | Transformation lead | Every production agent passing, scoped, and owned |
| AI policy, PHI, and regulatory | Finance lead with IT and security lead | Compliance with Section 8 |
Incentives and change. Function leads carry their P&L line targets from the bridge in their compensation. Success is paid on net retention, sales on productivity, engineering on releases and quality together. Every employee completes the AI-skills curriculum in the first ninety days and has agent use in their role expectations by month six. The redeployment commitment is made in writing: people whose work is automated in the first eighteen months are offered a role in growth work first. The company talks about agents as colleagues with job descriptions, which is both accurate and the fastest way to get adoption past the 36% of portfolio companies FTI found using AI across multiple use cases.3
7. The data, platform and security foundation
Every lever above depends on the same handful of things being true, and they are built in the first hundred days.
One warehouse. Billing, CRM, product usage events, support, finance, and HR data joined at the customer and employee level, refreshed at least daily. This is the source for health scores, value analysis, pricing, forecasting, the weekly review, and the board package.
An event stream. Product usage instrumented at the action level (visits verified, claims submitted, documents generated), because it is the basis of usage pricing, health scoring, and the hours-saved measurement behind the modules.
A knowledge base that is the product for agents. Documentation, policies, contracts, playbooks, and resolved cases, structured and maintained by agents with expert review.
A definition of "agent" that everyone uses. The word is doing a lot of work in this document, so it should mean one thing. Anthropic's engineering guidance draws the line I use: "Workflows are systems where LLMs and tools are orchestrated through predefined code paths," while "agents ... are systems where LLMs dynamically direct their own processes and tool usage, maintaining control over how they accomplish tasks," and its advice is to find "the simplest solution possible, and only increasing complexity when needed."66 Most of what this playbook deploys in year one is workflow by that definition: a fixed sequence with a model at one or two steps. The distinction matters for governance, because an agent that chooses its own tool calls needs the permission and evaluation discipline below in a way a workflow does not.
Model access under BAAs, through one gateway. Enterprise agreements with at least two model providers under business associate agreements, routed through one gateway that logs every prompt and output containing PHI as ePHI, enforces which models may see which data classes, and tracks cost by agent. The retention term is the one the provider's BAA actually offers, and it is not always zero. As of July 2026 Anthropic's documentation states that "HIPAA readiness and ZDR cannot coexist on a single 1P API organization," and that its covered models "require 30-day data retention"; OpenAI offers a BAA on its API and enterprise products with zero-data-retention available on eligible endpoints, and does not offer one on its Business plan.67 The playbook's rule is therefore covered endpoint first, shortest retention the BAA allows second, and the retention term written into the agent's register entry so that it is a known fact rather than an assumption.
An evaluation harness. Every agent has a test set drawn from real cases, a passing threshold, and automated re-evaluation on any model, prompt, or tool change. Agents that fail do not run. Hamel Husain's framing is the right one: "Unsuccessful products almost always share a common root cause: a failure to create robust evaluation systems," with three levels, assertion-style unit tests, human and model review of traces, and A/B tests on the outcomes the product is meant to move.68 The 300-ticket set in 3.1 is a level-one and level-two artifact; the control cohorts in 3.4 are level three.
Identity and permissions for agents. Every agent has its own identity, least-privilege scopes, and audit logging, exactly as an employee would. OWASP names the failure this prevents: "Excessive Agency is the vulnerability that enables damaging actions to be performed in response to unexpected, ambiguous or manipulated outputs from an LLM," with root causes of "excessive functionality; excessive permissions; excessive autonomy," and its remedy is to "limit the permissions that LLM extensions are granted to other systems to the minimum necessary."69
The agent register. At Certivo, building an AI-native company from zero, the artifact that turned out to matter most was not any single agent but the register of all of them: which one existed, who owned it, what it was allowed to touch, what evaluation it had last passed, and what it cost that month. Without it, the second question in every incident review ("which agent did this, and who changed it?") took a day to answer. In an acquired company the register is built in week one and reviewed monthly, and it is the document the risk committee reads.
Vendor discipline. A short list of platforms per function, chosen for BAA availability, integration with the warehouse, evaluation support, and exportability of data. Gartner's estimate that "only about 130 of the thousands of agentic AI vendors are real" is the reason for a reference check and a paid pilot before any annual commitment.2
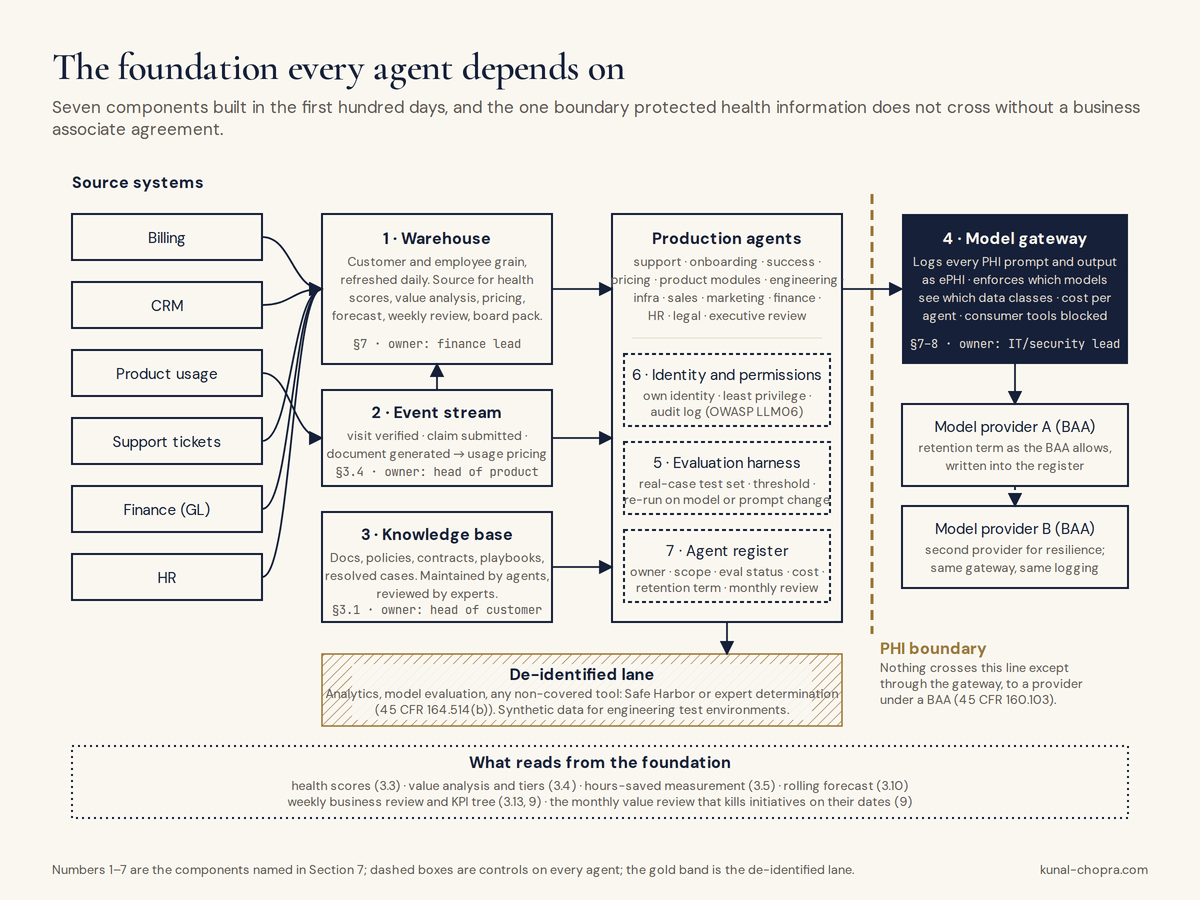
8. Regulatory guardrails for AI in healthcare software
The company is a business associate under HIPAA and its customers are covered entities. That shapes every agent that touches customer data, and it is also a commercial advantage: competitors that handle this carelessly will be the ones the regulator names.
HIPAA and business associate agreements. The regulation defines a business associate as a person who "creates, receives, maintains, or transmits protected health information" on behalf of a covered entity, and the security rule requires every covered entity and business associate to "conduct an accurate and thorough assessment of the potential risks and vulnerabilities to the confidentiality, integrity, and availability of electronic protected health information."70 That risk analysis is where enforcement has concentrated. HHS's Office for Civil Rights announced in March 2026 its twelfth action under the Risk Analysis Initiative: a $10,000 settlement and a three-year corrective action plan with MMG Fusion, "a Maryland software company" and business associate, after a breach affecting fifteen million people, for failure to conduct "an accurate and thorough risk analysis."71 The amount is small; the precedent, a software business associate named for a missing risk analysis, is the one to cite internally. The annual risk analysis in this playbook explicitly covers AI systems, consumer and non-covered tools are blocked at the gateway, and prompts and outputs containing PHI are logged and protected as ePHI.
De-identification. Analytics, model evaluation, and any non-covered tool use data de-identified under the Safe Harbor method, which requires removal of the eighteen identifier classes listed at 45 CFR 164.514(b)(2), or under an expert determination that the risk of re-identification is "very small."70 Synthetic data is used for engineering test environments.
Section 1557 and clinical decision support. Since May 1, 2025, a covered entity has "an ongoing duty to make reasonable efforts to identify uses of patient care decision support tools in its health programs or activities that employ input variables or factors that measure race, color, national origin, sex, age, or disability," and "must make reasonable efforts to mitigate the risk of discrimination" from them.72 Any tool that influences a clinical or coverage decision (authorization support, denial prediction, scheduling triage that affects care) carries a documented bias review, monitoring, and a human decision-maker.
State law. California requires that generative-AI patient communications carry "a disclaimer that indicates to the patient that the communication was generated by generative artificial intelligence" unless "read and reviewed by a human licensed or certified health care provider" (AB 3030); provides that AI "shall not deny, delay, or modify health care services based, in whole or in part, on medical necessity," a determination to be "made only by a licensed physician or licensed health care professional competent to evaluate the specific clinical issues" (SB 1120); and, from January 2026, bars AI systems from using terms that imply care is "provided by a natural person in possession of the appropriate license or certificate" (AB 489).73 Texas's Responsible Artificial Intelligence Governance Act, effective January 1, 2026, requires that when "an artificial intelligence system is used in relation to health care service or treatment, the provider ... shall provide the disclosure ... not later than the date the service or treatment is first provided," and gives the attorney general "exclusive authority to enforce this chapter," with civil penalties up to $200,000 per uncurable violation.74 Colorado repealed and re-enacted its AI act in May 2026 with obligations from January 1, 2027, leaving HIPAA covered entities and business associates largely exempt outside employment and financial-assistance decisions, and separately barred insurers from denying coverage "solely on the output of an AI system without human review by a licensed clinician or physician."75 Utah requires a mental health chatbot to "clearly and conspicuously disclose to a Utah user that the mental health chatbot is an artificial intelligence technology and not a human," and Illinois prohibits AI from making "independent therapeutic decisions" or engaging in "any form of therapeutic communication" with clients.76 Regulatory monitoring (3.12) tracks these by state, and product features carry state-configurable disclosures and human-review steps.
Human sign-off rules. Clinical documentation is signed by an authorized person. Coverage, authorization, and medical-necessity outcomes are decided by people. Patient-facing communications disclose AI assistance where required and are reviewed where they concern care. Collections and billing actions on patient accounts are approved by people.
Customer contracts. Customer agreements and BAAs are updated to describe AI processing, sub-processors, retention, and the customer's configuration choices before the first customer-facing agent ships.
9. Measuring and reporting value
The KPI tree. Enterprise value sits at the top; below it, ARR growth, EBITDA margin, gross and net retention, and AI attach as the four drivers buyers price; below those, the function metrics in Section 3; below those, the agent-level metrics in the register. Every metric has a source, an owner, and a target by quarter, and the weekly review shows the tree with variances. NIST's framing of measurement applies: the Measure function "employs quantitative, qualitative, or mixed-method tools, techniques, and methodologies to analyze, assess, benchmark, and monitor AI risk and related impacts," and the register is where that happens for value as well as risk.77
The initiative card. Every initiative in the value plan is described on one card, maintained by the transformation office and reviewed monthly. The fields are fixed so that initiatives can be compared and killed on evidence.
| Field | Content |
|---|---|
| Name and function | One line; the chapter it belongs to |
| Horizon | Deploy, Reshape, or Invent |
| P&L line and metric | The line it moves and the operating metric that proves it |
| Baseline | Measured value at start, with date and source |
| Target and date | Year 1 and year 3 values from Section 3, and the date by which first movement must show |
| Value at target | Annualized dollars, points of retention, or days of working capital |
| Owner | The function lead; the transformation office is never the owner |
| Build or buy | Vendor selected, or the build justification |
| Prerequisites | Data, systems, policy, or people required first |
| Guardrails | Human approval points, PHI handling, regulatory constraints |
| Evaluation | Test set, threshold, and re-evaluation triggers for any agent involved |
| Kill date | The date the initiative is stopped if the target metric has not moved |
| Status and last measurement | Updated monthly |
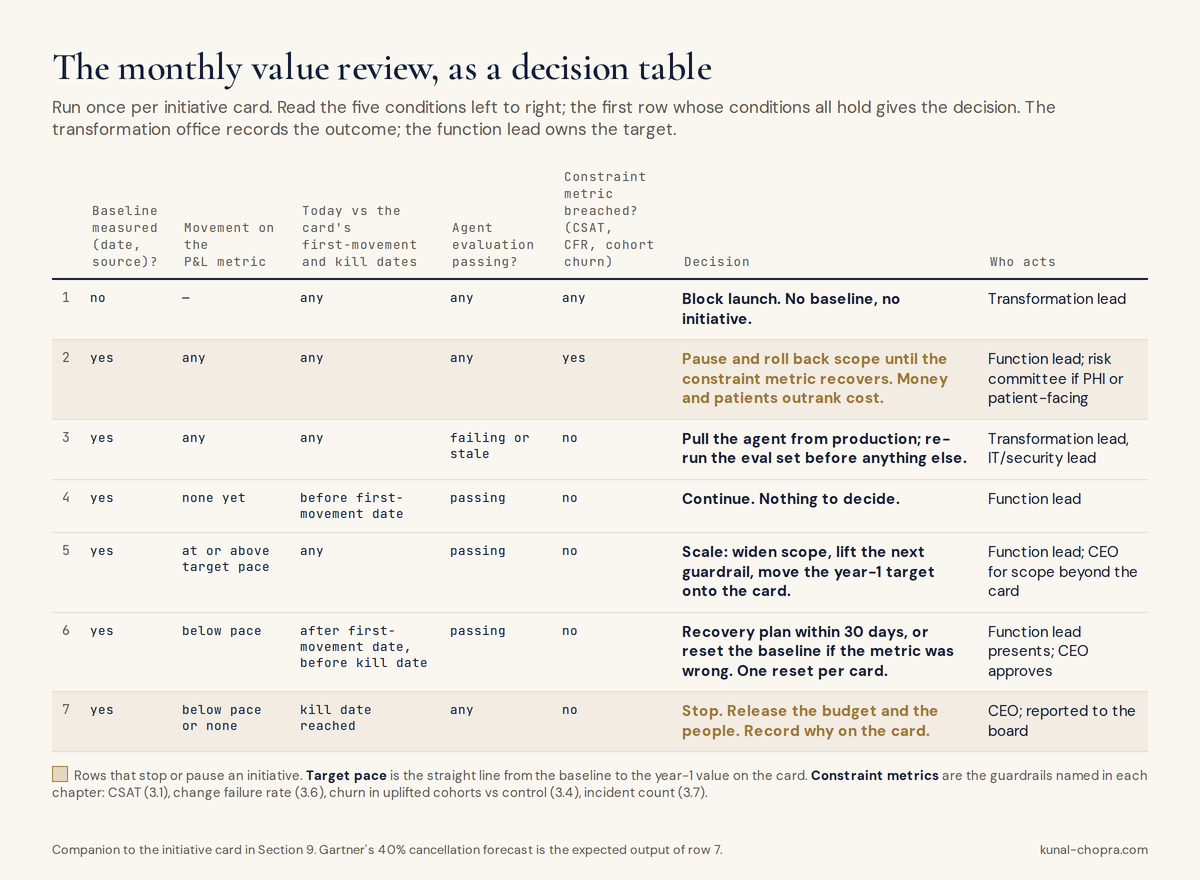
The value creation plan at a glance. The initial plan for the illustrative company, ranked by year-three value. Values are annualized EBITDA impact unless noted and sum to more than the bridge because some overlap; the bridge is the binding number.
| # | Initiative | Function | Horizon | Year-3 value | Start |
|---|---|---|---|---|---|
| 1 | Value-based tiers and renewal uplift program | 3.4 | Reshape | $0.7M revenue, ~$0.6M EBITDA | Q2 |
| 2 | Paid AI modules (documentation, authorizations, denials) | 3.5 | Invent | $1.2M revenue, ~$0.9M EBITDA | Q1 design, Q3 GA |
| 3 | Agent-first support | 3.1 | Deploy | $0.55M | Q1 |
| 4 | Coding agents, test generation, modernization | 3.6 | Deploy then Reshape | $0.5M | Q1 |
| 5 | Finance automation: close, AR, AP, FP&A | 3.10 | Deploy | $0.3M plus $0.63M cash | Q1 |
| 6 | Health scoring and success on net retention | 3.3 | Reshape | $0.4M revenue retained | Q2 |
| 7 | Onboarding agents and repriced implementation | 3.2 | Reshape | $0.25M plus faster revenue | Q2 |
| 8 | Outbound engine and sales productivity | 3.8 | Deploy | $0.9M new ARR | Q2 |
| 9 | FinOps, incident, and compliance automation | 3.7 | Deploy | $0.2M | Q1 |
| 10 | HR helpdesk, recruiting, redeployment program | 3.11 | Deploy | $0.1M plus enablement | Q1 |
| 11 | Contract lifecycle and regulatory monitoring | 3.12 | Deploy | $0.06M plus sales cycle | Q2 |
| 12 | Content and account-based engine | 3.9 | Deploy | $0.4M pipeline contribution | Q2 |
| 13 | Usage metering and outcome-based pricing elements | 3.4 | Invent | Valuation resilience | Q1 instrument, Y2 price |
| 14 | Weekly business review and agent register | 3.13 | Deploy | Executive capacity | Q1 |
10. What goes wrong
The failure modes are known, and each has a countermeasure in this playbook.
Pilots that never touch the P&L. MIT NANDA's finding that "sales and marketing functions captured approximately 70 percent of AI budget allocation" while back-office deployments "delivered faster payback periods and clearer cost reductions" is a description of tools chosen for visibility rather than return.1 Countermeasure: every initiative carries a P&L line and a kill date, and back-office levers with proven returns are deployed first.
Automating before repricing. The company makes implementation faster and cheaper, then keeps billing hours. Revenue falls. Countermeasure: the pricing decision precedes the automation in every customer-facing function.
Cutting support quality to hit a cost number. Klarna's reversal is the reference case. Countermeasure: true-resolution measurement, CSAT held as a hard constraint, and humans on anything that touches money or patients.
Velocity without quality. Faros' 2026 data: more throughput, more bugs, fivefold review time, more incidents per PR. Countermeasure: test generation and review agents before coding agents scale, and change failure rate as a gate.
Building what should be bought. Internal builds reached deployment half as often as purchased tools in the MIT sample. Countermeasure: build only where the workflow is the product or the data is proprietary.
Agent washing. Gartner counts roughly 130 real vendors among thousands; 11x invented customers. Countermeasure: paid pilots with measured outcomes before annual commitments, and reference calls with named customers.
Revenue leakage through the transition. Customers bought from the founder; the change of control and the first price increase are the moment they look elsewhere. Countermeasure: no headcount reductions in the first two quarters, a founder transition agreement, uplift cohorts with controls, and visible new value before any increase.
PHI in the wrong place. One employee pasting patient data into a consumer tool is a reportable breach. Countermeasure: the gateway, the block list, the policy, the training, and the logging in Section 7.
The transformation office becomes the owner. Function leads treat AI as someone else's project. Countermeasure: the office owns measurement and engineering support; the function lead owns the target and carries it in compensation.
Stopping at Deploy. The company buys tools, saves some cost, and never ships a product customers pay for; competitors buy the same tools and the margin advantage evaporates. McKinsey's data says the market prices this outcome at almost nothing.4 Countermeasure: the first paid module ships inside twelve months, and 40% of engineering capacity is on customer-facing AI by year three.
11. The objection
The strongest case against this document is that the aggregate evidence for AI productivity is small, and that a bridge built on vendor case studies is a bridge built on survivorship. Humlum and Vestergaard, using Danish administrative data on 25,000 workers across 11 exposed occupations, "estimate precise zeros: AI chatbots have had no significant impact on earnings or recorded hours in any occupation," with "modest productivity gains (average time savings of 3%)," and their 2026 revision still rules out effects larger than 2% two years after ChatGPT's launch.78 Acemoglu's calibration puts the macro effect at "no more than a 0.66% increase in total factor productivity (TFP) over 10 years."79 Bain and StepStone's 2026 GP survey found that "within portfolio companies, benefits skew toward cost savings, with nearly 40% of GPs not expecting material financial impact from AI in 2026."80 And the study I opened with, MIT NANDA, rests on 52 interviews and a 153-person survey, with "success" defined as executives having "remarked" on a sustained impact within six months; critics have pointed out that the 5% may rest on two or three companies.81 If the aggregate effect is 3% of hours and the headline failure rate is unreliable, why should a sixty-person company plan on sixteen points of margin?
The objection is right about three things, and the playbook is built around them. It is right that task-level gains are uneven and concentrated in specific work: Dell'Acqua's preregistered experiment with 758 consultants found those using AI "completing 12.2% more tasks and completing them 25.1% more quickly" inside the frontier of what the model could do, and "19% less likely to produce correct solutions" on a task outside it.82 That is why the chapters pick their tasks narrowly (reconciliations, tier-1 tickets, test generation, appeal packages) and refuse others (medical necessity, care plans, merges to production). It is right that wage and hours effects at the economy level lag firm-level changes, which is precisely why a firm that does redesign its roles captures the gain that the average firm does not; Humlum and Vestergaard's 3% is the average over firms that mostly did nothing with the time saved. And it is right that vendor evidence is survivorship-biased, which is why the P&L map grades every lever, why the weakest-evidenced chapters (implementation, marketing) are run as internal measurement programs, and why every initiative has a kill date.
Where the objection is wrong is in what it measures. The playbook's margin does not come from 3% time savings distributed across sixty people. It comes from four or five discrete structural changes: implementation repriced into the subscription, a support function that resolves 60% of volume without a person, a finance function of two, a codebase with test coverage, and a product tier the customer pays more for. Each of those is a role redesign or a pricing decision, and none of them is what a chatbot-adoption survey measures. The honest version of the claim is narrower than the enthusiasts' and larger than the skeptics': the technology delivers small gains on average and large gains where a company reorganizes around it, and the entire point of owning the company is that you get to reorganize it.
What this means for the operator and the board
Three decisions follow from all of this, and they are decisions rather than exhortations.
The first is made before close: the pricing and packaging change is diligenced alongside the technology, and the bridge is not approved without it. A plan that automates implementation without repricing it, or ships AI features without tiers to attach them to, has given away the largest lever in the document for the convenience of a cleaner org chart.
The second is made in the first hundred days: the foundation (warehouse, event stream, gateway, evaluation harness, register) is funded as a single line item and built before most agents go live, and the board asks for the day-100 review to show three moved numbers, not a list of tools installed.
The third is made every month for three years: the value review kills initiatives on their dates. Read Gartner's 40% cancellation forecast as a description of hygiene rather than a prediction of failure. A company that has cancelled six initiatives on schedule and kept eight that moved their lines is running the plan. A company with fourteen initiatives all "in progress" at month eighteen is running the one I was handed.
The bridge from 25% to 41% is arithmetic once the chapters are true. The work is making the chapters true, in order, with the customer paying for the parts the customer values, and a person signing everything that touches money or patients.
— Kunal
Sources
Every source below was opened during the preparation of this essay in September 2026. (I) marks independent studies, surveys, standards and regulators; (V) marks vendor-published results with a named customer; (V, anonymous) marks vendor results without one; (V, portfolio) marks a sponsor reporting on its own selected portfolio companies.
- MIT NANDA, The GenAI Divide: State of AI in Business 2025 (Challapally, Pease, Raskar, Chari), July 2025. 52 interviews, 153 survey responses, 300+ public initiatives. https://mlq.ai/media/quarterly_decks/v0.1_State_of_AI_in_Business_2025_Report.pdf (I, methodology contested; see 81)↩
- Gartner, "Gartner Predicts Over 40% of Agentic AI Projects Will Be Canceled by End of 2027," press release, June 25, 2025. https://www.gartner.com/en/newsroom/press-releases/2025-06-25-gartner-predicts-over-40-percent-of-agentic-ai-projects-will-be-canceled-by-end-of-2027 (I)↩
- FTI Consulting, 2026 Private Equity AI Radar, May 19, 2026, n=200 fund and operating leaders. https://www.fticonsulting.com/insights/reports/2026-private-equity-ai-radar (I)↩
- McKinsey & Company, "Beyond productivity: How AI creates value in private equity," June 23, 2026, n=471 PE-backed companies. https://www.mckinsey.com/capabilities/business-building/our-insights/beyond-productivity-how-ai-creates-value-in-private-equity (I)↩
- SaaS Capital, "Spending Benchmarks for Private B2B SaaS Companies," June 10, 2026 (15th annual survey, 1,000+ companies). https://www.saas-capital.com/blog-posts/spending-benchmarks-for-private-b2b-saas-companies/ (I)↩
- SaaS Capital, "Revenue per Employee Benchmarks for Private SaaS Companies," July 30, 2026. https://www.saas-capital.com/blog-posts/revenue-per-employee-benchmarks-for-private-saas-companies/ (I)↩
- SaaS Capital, "Benchmarking Metrics for Bootstrapped SaaS Companies," April 24, 2026; and "What is a Good Retention Rate for a Private SaaS Company?", September 18, 2025. https://www.saas-capital.com/blog-posts/benchmarking-metrics-for-bootstrapped-saas-companies/ (I)↩
- Intercom, fin.ai homepage (accessed September 2026); "From resolutions to outcomes: evolving how Fin delivers value," March 12, 2026; resolution definitions from Intercom staff on the Intercom community forum. https://fin.ai/ ; https://www.intercom.com/blog/from-resolutions-to-outcomes-evolving-how-fin-delivers-value/ (V, anonymous)↩
- Lorikeet, "AI customer support resolution rate benchmarks 2026" (Steve Hind), updated September 2, 2026. https://www.lorikeetcx.ai/articles/resolution-rate-ai-customer-support-benchmarks-2026 (V, synthesis of vendor data)↩
- Klarna, "Klarna AI assistant handles two-thirds of customer service chats in its first month," PR Newswire, February 27, 2024. https://www.prnewswire.com/news-releases/klarna-ai-assistant-handles-two-thirds-of-customer-service-chats-in-its-first-month-302072740.html (V)↩
- Sebastian Siemiatkowski to Bloomberg, May 8, 2025, as reported by Fortune, May 9, 2025, and Customer Experience Dive. https://www.fortune.com/2025/05/09/klarna-ai-humans-return-on-investment ; https://www.customerexperiencedive.com/news/klarna-reinvests-human-talent-customer-service-AI-chatbot/747586/ (I)↩
- Brynjolfsson, Li and Raymond, "Generative AI at Work," Quarterly Journal of Economics 140(2), 2025; NBER Working Paper 31161. https://www.nber.org/papers/w31161 (I)↩
- KeyBanc Capital Markets, 2017 Private SaaS Company Survey (2016 data), via forentrepreneurs.com; Benchmarkit, 2025 B2B SaaS Performance Metrics Benchmarks. https://www.forentrepreneurs.com/2017-saas-survey-part-1/ ; https://www.benchmarkit.ai/2025benchmarks (I)↩
- Flatfile, "BuildOps clears data import bottleneck with Flatfile," case study (2022 implementation, undated). https://flatfile.com/resources/case-studies/buildops-clears-data-import-bottleneck-with-flatfile/ (V)↩
- WellSky, "WellSky launches AI-powered ambient documentation for personal care, enabled by AutoMynd," April 30, 2026. https://wellsky.com/wellsky-launches-ai-powered-ambient-documentation-for-personal-care-enabled-by-automynd/ (V, anonymous)↩
- Gainsight, "Aqua Security predicts churn with 95% accuracy, thanks to Staircase AI," case study, undated. https://www.gainsight.com/customer/aqua-security-predicts-churn-with-95-accuracy-thanks-to-staircase-ai/ (V)↩
- Vista Equity Partners, AI Impact: Vista Portfolio 2026 Mid-Year Report, July 16, 2026. Figures are for Vista-selected subsets of its portfolio (n=17 for ARR per CSM; n=54 for R&D; n=55 for S&M). https://www.vistaequitypartners.com/insights/ai-impact-vista-portfolio-2026-mid-year-report/ (V, portfolio)↩
- Eva Ascarza, "Retention Futility: Targeting High-Risk Customers Might Be Ineffective," Journal of Marketing Research 55(1), 2018. https://papers.ssrn.com/sol3/papers.cfm?abstract_id=2759170 (I)↩
- Salesforce, "Salesforce Pricing Update 2025," June 17, 2025; Slack, "June 2025 pricing and packaging announcement," June 17, 2025. https://www.salesforce.com/news/stories/pricing-update-2025/ ; https://slack.com/blog/news/june-2025-pricing-and-packaging-announcement (V)↩
- CFO Dive, "Enterprise software bills climb amid AI pricing volatility: Zylo," January 29, 2026, on Zylo's 2026 SaaS Management Index. https://www.cfodive.com/news/enterprise-software-bills-climb-amid-ai-pricing-volatility-zylo/810908/ ; https://zylo.com/2026-saas-management-index (I)↩
- KeyBanc Capital Markets and Sapphire Ventures, "Private SaaS Company Survey Reveals AI-Driven Transformation and Sustained Operational Excellence," November 13, 2025. https://www.prnewswire.com/news-releases/private-saas-company-survey-reveals-ai-driven-transformation-and-sustained-operational-excellence-302615030.html (I)↩
- a16z, "AI is driving a shift towards outcome-based pricing," enterprise newsletter, December 19, 2024. https://a16z.com/newsletter/december-2024-enterprise-newsletter-ai-is-driving-a-shift-towards-outcome-based-pricing/ (I)↩
- Kyle Poyar, "The state of B2B monetization in 2026," Growth Unhinged, May 13, 2026, 230+ companies. https://www.growthunhinged.com/p/the-state-of-b2b-monetization-in-2026 (I)↩
- Rotenstein L. et al., "Changes in Clinician Time Expenditure and Visit Quantity With Adoption of Artificial Intelligence–Powered Scribes: A Multisite Study," JAMA, published online April 1, 2026, doi:10.1001/jama.2026.2253; reported by STAT News the same day. https://jamanetwork.com/journals/jama/article-abstract/2847319 ; https://www.statnews.com/2026/04/01/ai-ambient-scribes-modest-time-savings-clinical-documentation/ (I)↩
- Sutter Health, "Sutter Health Study Highlights the Power and Potential of Ambient AI to Improve Clinician Well-Being," May 2, 2025 (study published in JAMA Network Open). https://www.globenewswire.com/news-release/2025/05/02/3073397/0/en/Sutter-Health-Study-Highlights-the-Power-and-Potential-of-Ambient-AI-to-Improve-Clinician-Well-Being.html (I)↩
- Microsoft, "Microsoft Dragon Copilot provides the healthcare industry's first unified voice AI assistant," March 3, 2025. https://news.microsoft.com/source/2025/03/03/microsoft-dragon-copilot-provides-the-healthcare-industrys-first-unified-voice-ai-assistant-that-enables-clinicians-to-streamline-clinical-documentation-surface-information-and-automate-task/ (V, anonymous, self-reported)↩
- John Lynn, "Availity Is Already Automating Prior Auths," Healthcare IT Today, July 17, 2025. https://www.healthcareittoday.com/2025/07/17/availity-is-already-automating-prior-auths/ (V, anonymous)↩
- Waystar, "Waystar Advances AI Leadership with Next-Generation Denial Prevention and Reimbursement Recovery Innovations," September 16, 2025; restated November 10, 2025. https://www.prnewswire.com/news-releases/waystar-advances-ai-leadership-with-next-generation-denial-prevention-and-reimbursement-recovery-innovations-302557581.html (V, anonymous)↩
- Experian Health, "Experian Health's 3rd annual State of Claims survey," September 22, 2025, n=250. https://www.experianplc.com/newsroom/press-releases/2025/experian-health-s-3rd-annual-state-of-claims-survey-finds-denial (I)↩
- Sacra, "Abridge" company profile (Abridge ~$2,500 per clinician per year; Nabla $119 per month); DictationOne reseller listing for DAX Copilot at $600 per user per month; eesel, "Nabla AI pricing," October 1, 2025. https://sacra.com/c/abridge/ ; https://www.dictationone.com/Dragon-Ambient-eXperience-DAX-Copilot-AI-copilot-for-automated-clinical-documentat.html (I, reported and list prices)↩
- METR, "Measuring the Impact of Early-2025 AI on Experienced Open-Source Developer Productivity," arXiv:2507.09089, July 2025; and "Uplift update," February 24, 2026. https://arxiv.org/abs/2507.09089 ; https://metr.org/blog/2026-02-24-uplift-update/ (I)↩
- Cui, Demirer, Jaffe, Musolff, Peng and Salz, "The Effects of Generative AI on High-Skilled Work: Evidence from Three Field Experiments with Software Developers," Management Science, February 27, 2026. https://papers.ssrn.com/sol3/papers.cfm?abstract_id=4945566 (I)↩
- Faros AI, The AI Productivity Paradox 2026: Acceleration Whiplash, 22,000 developers, 4,000 teams. https://www.faros.ai/research/ai-acceleration-whiplash (I, vendor telemetry)↩
- Google Cloud, "Announcing the 2025 DORA report: State of AI-assisted Software Development," September 23, 2025. https://cloud.google.com/blog/products/ai-machine-learning/announcing-the-2025-dora-report (I)↩
- High Alpha, 2025 SaaS Benchmarks Report, 800+ respondents; and "Is your team overstaffed for the AI era?", March 25, 2026. https://www.highalpha.com/blog/is-your-team-overstaffed-for-the-ai-era-b2b-saas-company-benchmarks (I)↩
- Andy Jassy, LinkedIn and X, August 22, 2024; AWS DevOps Blog, "Amazon Q Developer just reached a $260 million dollar milestone," August 1, 2024. https://aws.amazon.com/blogs/devops/amazon-q-developer-just-reached-a-260-million-dollar-milestone (V, internal estimate)↩
- FinOps Foundation, "What is FinOps?", definition updated March 2026. https://www.finops.org/introduction/what-is-finops/ (I)↩
- Flexera, "Flexera finds cloud value is rising while AI waste grows," 2026 State of the Cloud Report, March 18, 2026, 750+ respondents. https://www.flexera.com/about-us/press-center/flexera-finds-cloud-value-is-rising-while-ai-waste-grows (I)↩
- Cast AI, Akamai case study (Dekel Shavit quote). https://cast.ai/case-studies/akamai/ (V)↩
- SolarWinds, "New SolarWinds Report: Gen AI Significantly Drops Incident Response Time," 2025 State of ITSM, October 21, 2025, 2,000+ ITSM systems, 60,000+ records. https://www.businesswire.com/news/home/20251021557339/en/New-SolarWinds-Report-Gen-AI-Significantly-Drops-Incident-Response-Time (V, aggregate telemetry)↩
- Bono, Xu and Grana, "Generative AI and Security Operations Center Productivity: Evidence from Live Operations," Microsoft, November 2024, arXiv:2411.01067 (observational, propensity-matched); Microsoft, "Randomized Controlled Trial for Microsoft Security Copilot," January 2024. https://arxiv.org/abs/2411.01067 (V, self-run)↩
- Vanta, healthcare solutions page (85% figure, uncited); IDC, The Business Value of Vanta, January 2025, sponsored by Vanta (82% figure). https://www.vanta.com/solutions/healthcare ; https://www.vanta.com/resources/idc-highlights-the-business-value-of-vanta (V, sponsored)↩
- Clay, "How A-LIGN cut research costs by 83% and generated millions in pipeline," undated. https://www.clay.com/customers/a-lign (V)↩
- Artisan, "How much does an AI SDR cost?", July 21, 2026. https://www.artisan.co/blog/how-much-does-an-ai-sdr-cost-pricing-compared-to-human-sdrs (V)↩
- Momentum, Ramp and ScyllaDB customer stories, undated. https://www.momentum.io/customer/ramp ; https://www.momentum.io/customer/scylladb (V)↩
- Gong Labs, "New Gong Labs research finds AI is now a trusted decision-maker in revenue teams," December 4, 2025, 7.1M opportunities across 3,613 companies; VentureBeat coverage the same day. https://www.gong.io/press/new-gong-labs-research-finds-ai-is-now-a-trusted-decision-maker-in-revenue-teams (V, self-run, correlational)↩
- Hunter, The State of Cold Email 2026 (31M emails); Saleshandy, "AI vs human cold emails," June 20, 2026 (12,000-email test); Digital Applied, "AI SDR real performance: 100K email analysis," April 26, 2026. https://hunter.io/the-state-of-cold-email ; https://www.saleshandy.com/blog/ai-vs-human-cold-emails/ (I, vendor datasets)↩
- Dominic-Madori Davis and Marina Temkin, "a16z- and Benchmark-backed 11x has been claiming customers it doesn't have," TechCrunch, March 24, 2025. https://techcrunch.com/2025/03/24/a16z-and-benchmark-backed-11x-has-been-claiming-customers-it-doesnt-have (I)↩
- Jasper, WalkMe and Akbank case studies, undated. https://www.jasper.ai/case-studies/walkme ; https://www.jasper.ai/case-studies/akbank (V)↩
- Ahrefs, "AI Overviews reduce clicks by 58% (update)," February 4, 2026, 300,000 keywords; original April 17, 2025 study (34.5%). https://ahrefs.com/blog/ai-overviews-reduce-clicks-update/ (I)↩
- Search Engine Land, "Google zero-click searches hit 68% in 2026: study," June 9, 2026, on SparkToro's analysis of Similarweb clickstream data, January to April 2026. https://searchengineland.com/google-zero-click-searches-2026-study-479717 (I)↩
- APQC, "What is DSO in finance?", June 24, 2025 (top ≤30 days, median 38, bottom ≥46); APQC monthly-close cycle-time benchmarks (top five days or less, median six, bottom ten or more) via Rand Group, June 1, 2026. https://www.apqc.org/resources/blog/what-dso-finance ; https://www.randgroup.com/insights/services/how-long-should-month-end-close-take-benchmarks-red-flags-and-best-practices/ (I)↩
- Jim Tyson, "AI cuts monthly financial close time by 7.5 days: MIT/Stanford study," CFO Dive, August 13, 2025, on Choi (MIT Sloan) and Xie (Stanford GSB), 79 SMB clients of an AI-enabled accounting platform. https://www.cfodive.com/news/ai-cuts-monthly-financial-close-time-75-days-mit-stanford-study-accounting-accountants/757610/ (I)↩
- Numeric, "Numeric raises $51M Series B," November 19, 2025 (Brex match rate). https://www.prnewswire.com/news-releases/numeric-raises-51m-series-b-expanding-from-close-management-to-comprehensive-finance-platform-302619774.html (V)↩
- Tesorio, customer stories for Couchbase, Seismic and Discovery Education, undated. https://www.tesorio.com/case-studies ; https://www.tesorio.com/customers/discovery-education (V)↩
- Vic.ai, "Why Vic.ai" ("up to an 85% no-touch invoice rate"); Brex, "Accelerate accounting from transaction to close"; Ramp, "Accounting Agent launch," February 12, 2026. https://www.vic.ai/why-vic-ai ; https://www.brex.com/journal/accelerate-accounting-transaction-to-close ; https://ramp.com/blog/accounting-agent-launch (V)↩
- Pigment, Supercell customer story (Lauri Sulonen, FP&A Manager), undated. https://www.pigment.com/customer-stories/supercell (V)↩
- Paradox, 7-Eleven case study, undated. https://www.paradox.ai/case-studies/7-eleven (V)↩
- Moveworks, "Databricks scale employee support from 10% to 73% ticket deflection," community post, August 13, 2025; Databricks customer page. https://www.moveworks.com/us/en/customers/how-databricks-scaled-support-with-extreme-automation (V)↩
- Harvey, "How Harvey saves lawyers time," July 31, 2025, and "How legal teams are driving real results with AI," November 11, 2025. https://www.harvey.ai/blog/how-harvey-saves-lawyers-time ; https://www.harvey.ai/blog/how-legal-teams-are-driving-real-results-with-ai (V)↩
- Ironclad, Poshmark customer story, July 14, 2023; "How Hormel cut contracting time," webinar. https://ironcladapp.com/resources/customer-stories/poshmark ; https://ironcladapp.com/resources/webinars/how-hormel-cut-contracting-time (V)↩
- Aventis Advisors, "SaaS Valuation Multiples," August 31, 2026; L40, "SaaS multiples," May 14, 2026. https://aventis-advisors.com/saas-valuation-multiples/ ; https://www.l40.com/insights/saas-multiples (I, practitioner)↩
- Bain & Company, Global Private Equity Report 2026, March 2026 ("12 is the new 5"). https://www.bain.com/insights/topics/global-private-equity-report/ (I)↩
- Bessemer Venture Partners, "The Rule of X," updated July 18, 2025. https://www.bvp.com/atlas/the-rule-of-x (I)↩
- Thoma Bravo, "Thoma Bravo and Google Cloud Launch Strategic Partnership to Deliver on the Promise of AI for Enterprise Software," April 15, 2026. https://www.thomabravo.com/press-releases/thoma-bravo-and-google-cloud-launch-strategic-partnership-to-deliver-on-the-promise-of-ai-for-enterprise-software (V)↩
- Anthropic, "Building effective agents," December 19, 2024. https://www.anthropic.com/engineering/building-effective-agents (V, vendor documentation)↩
- Anthropic, "Covered Models under a Business Associate Agreement (BAA)," July 1, 2026, and "Does Anthropic offer a BAA?" (support article 8114513); OpenAI, "How can I get a Business Associate Agreement (BAA) with OpenAI?" (help article 8660679) and API data-usage guide. https://support.claude.com/en/articles/15455031-covered-models-under-a-business-associate-agreement-baa ; https://support.claude.com/en/articles/8114513 ; https://help.openai.com/en/articles/8660679 (V, vendor documentation)↩
- Hamel Husain, "Your AI Product Needs Evals," March 29, 2024. https://hamel.dev/blog/posts/evals/ (I, practitioner)↩
- OWASP, "LLM06:2025 Excessive Agency," OWASP Top 10 for LLM Applications 2025. https://owasp.org/www-project-top-10-for-large-language-model-applications/2_0_vulns/LLM06_ExcessiveAgency.html (I, standard)↩
- 45 CFR 160.103 (definition of business associate); 45 CFR 164.514(b) (de-identification: expert determination and Safe Harbor); 45 CFR 164.308(a)(1)(ii)(A) (risk analysis), eCFR current as of September 3, 2026. https://www.ecfr.gov/current/title-45/subtitle-A/subchapter-C/part-160/subpart-A/section-160.103 ; https://www.ecfr.gov/current/title-45/subtitle-A/subchapter-C/part-164/subpart-E/section-164.514 ; https://www.ecfr.gov/current/title-45/subtitle-A/subchapter-C/part-164/subpart-C/section-164.308 (I, regulation)↩
- HHS Office for Civil Rights, MMG Fusion HIPAA resolution agreement, press release March 5, 2026 (twelfth action under the Risk Analysis Initiative; first action Bryan County Ambulance Authority, October 31, 2024). https://www.hhs.gov/press-room/ocr-mmg-fusion-hipaa-agreement.html (I, regulator)↩
- 45 CFR 92.210, "Nondiscrimination in the use of patient care decision support tools," 89 FR 37692 (May 6, 2024), applicability date May 1, 2025. https://www.ecfr.gov/current/title-45/subtitle-A/subchapter-A/part-92/subpart-C/section-92.210 (I, regulation)↩
- California AB 3030 (Ch. 848, Stats. 2024); SB 1120 (Ch. 879, Stats. 2024); AB 489 (Ch. 615, Stats. 2025, effective January 1, 2026). Chaptered texts via LegiScan. https://legiscan.com/CA/text/AB3030/id/3020084 ; https://legiscan.com/CA/text/SB1120/id/3023335 ; https://legiscan.com/CA/text/AB489/id/3272936 (I, statute)↩
- Texas HB 149, Texas Responsible Artificial Intelligence Governance Act, 89th Legislature, enrolled text, §552.051(f) and §552.101; effective January 1, 2026. https://capitol.texas.gov/tlodocs/89R/billtext/html/HB00149F.htm (I, statute)↩
- Colorado SB26-189 (signed May 14, 2026; obligations from January 1, 2027) and HB26-1139 (June 2, 2026); SB25B-004 (August 28, 2025) had earlier moved SB24-205's effective date to June 30, 2026. https://leg.colorado.gov/bills/sb26-189 ; https://leg.colorado.gov/bills/HB26-1139 (I, statute)↩
- Utah HB 452 (2025), Utah Code §13-72a-203, effective May 7, 2025; Illinois HB 1806, Wellness and Oversight for Psychological Resources Act, P.A. 104-0054, effective August 1, 2025. https://le.utah.gov/Session/2025/bills/enrolled/HB0452.pdf ; https://www.ilga.gov/documents/legislation/104/HB/PDF/10400HB1806lv.pdf (I, statute)↩
- NIST, Artificial Intelligence Risk Management Framework (AI RMF 1.0), NIST AI 100-1, January 2023. https://nvlpubs.nist.gov/nistpubs/ai/NIST.AI.100-1.pdf (I, standard)↩
- Anders Humlum and Emilie Vestergaard, "Large Language Models, Small Labor Market Effects," BFI Working Paper 2025-56, April 2025; NBER Working Paper 33777, revised March 2026 as "Still Waters, Rapid Currents." https://www.nber.org/papers/w33777 (I)↩
- Daron Acemoglu, "The Simple Macroeconomics of AI," NBER Working Paper 32487, May 2024; Economic Policy, 2024. https://www.nber.org/papers/w32487 (I)↩
- Bain & Company and StepStone Group, 2026 Private Equity GP Outlook, March 2, 2026. https://www.globenewswire.com/news-release/2026/03/02/3247360/0/en/Bain-Company-and-StepStone-Group-Release-2026-Private-Equity-GP-Outlook.html (I)↩
- Futuriom, "Why we don't believe MIT NANDA's weird AI study," August 26, 2025; 80,000 Hours podcast on the MIT study, April 28, 2026. https://www.futuriom.com/articles/news/why-we-dont-believe-mit-nandas-werid-ai-study/2025/08 ; https://80000hours.org/podcast/episodes/ai-workplace-mit-study/ (I, critique)↩
- Dell'Acqua, McFowland, Mollick, Lifshitz-Assaf, Kellogg, Rajendran, Krayer, Candelon and Lakhani, "Navigating the Jagged Technological Frontier," Organization Science, published online March 11, 2026 (HBS Working Paper 24-013, September 2023). https://www.hbs.edu/ris/Publication%20Files/dell-acqua-et-al-2026-navigating-the-jagged-technological-frontier_5c589c8c-fbb5-458f-b285-c944746cd717.pdf (I)↩