Essay
AI returns show up only in decisions the P&L already prices
Why hours saved never reach the income statement, what the attribution problem looks like in the field's own terms, and the rollout design that lets a CFO book an AI return without spinning a story.
Every board has now seen the slide. A pilot ran for a quarter. Usage climbed. A survey says people saved four hours a week. A multiplication follows: hours times headcount times a loaded wage, and the slide ends on a number with an M after it. Nobody can find that number anywhere in the ledger.
At the Kilts Center's marketing summit in April, Murli Buluswar, who has led analytics for Citi's US personal bank, described three levels at which AI touches a company: fluency, the baseline comfort of everyone with the tools; microproductivity, the small gains that add up only in the collective; and the eight to ten "big rocks" that change return on equity. He attached a measurement regime to each. At the first level you are not measuring anything. At the second you cannot measure the margin, only the aggregate. Only at the third do you measure lower costs and fewer errors that connect to financials. His test for an AI investment was that its effect be clear, material across functions, and attributable, and he was blunt about what happens otherwise: without attribution, every AI program becomes "a feel-good, high-five moment with no real discipline."1
My claim: an AI investment has an attributable return only when the model changes a decision whose outcome is already a line in the P&L. Everything upstream of that point, fluency, hours saved, tasks completed faster, is real, is worth funding, and cannot be booked as a return. A CFO who insists on the distinction will approve less AI spend on ROI grounds and more of it on the right grounds.
Two layers of evidence that disagree
The research on generative AI now comes in two layers, and they do not agree. The task layer shows large gains. Erik Brynjolfsson, Danielle Li and Lindsey Raymond followed the staggered rollout of an AI assistant to 5,172 customer-support agents and measured a 15 percent average increase in issues resolved per hour, with the largest gains for the least experienced agents.2 That is a well-identified, decision-relevant result: the firm already paid per resolved issue, so a 15 percent change in resolutions per hour is a change in a cost line.
The economy layer shows almost nothing. Anders Humlum and Emilie Vestergaard linked two large adoption surveys to Danish administrative records for about 25,000 workers in 11 occupations most exposed to chatbots. Users reported time savings averaging 2.8 percent of their hours. The effect on recorded earnings and hours was a precise zero, with confidence intervals that rule out anything above 1 percent.3 In the United States, the Federal Reserve's adoption tracker puts self-reported time saved at 2.2 percent of all work hours in the second quarter of 2026, up from 1.6 percent two years earlier, with 39 percent of employed adults using generative AI for work in a given week.4 McKinsey's 2026 survey of 1,719 executives found nearly nine in ten firms using AI in at least one function, 37 percent reporting any effect on enterprise EBIT, and 6 percent attributing 5 percent or more of EBIT to it.5
Robert Solow's 1987 line about seeing the computer age everywhere but in the productivity statistics gets quoted at this point.6 The narrower version is more useful. The task-level results are not wrong and the firm-level nulls are not wrong. They measure different things, and the gap between them is where the attribution problem lives.
Where the hours go
Two mechanisms close the gap, and both are arithmetic rather than mystery.
The first is reallocation. Humlum and Vestergaard asked users what they did with the time the chatbot saved. Eighty percent put it into other job tasks. Fewer than one in ten took it as leisure.3 Saved time that flows into other work is real productivity, but it reaches the P&L only if the other work was something the firm would otherwise have paid for. Usually it is slack absorbed, and slack has no cost center.
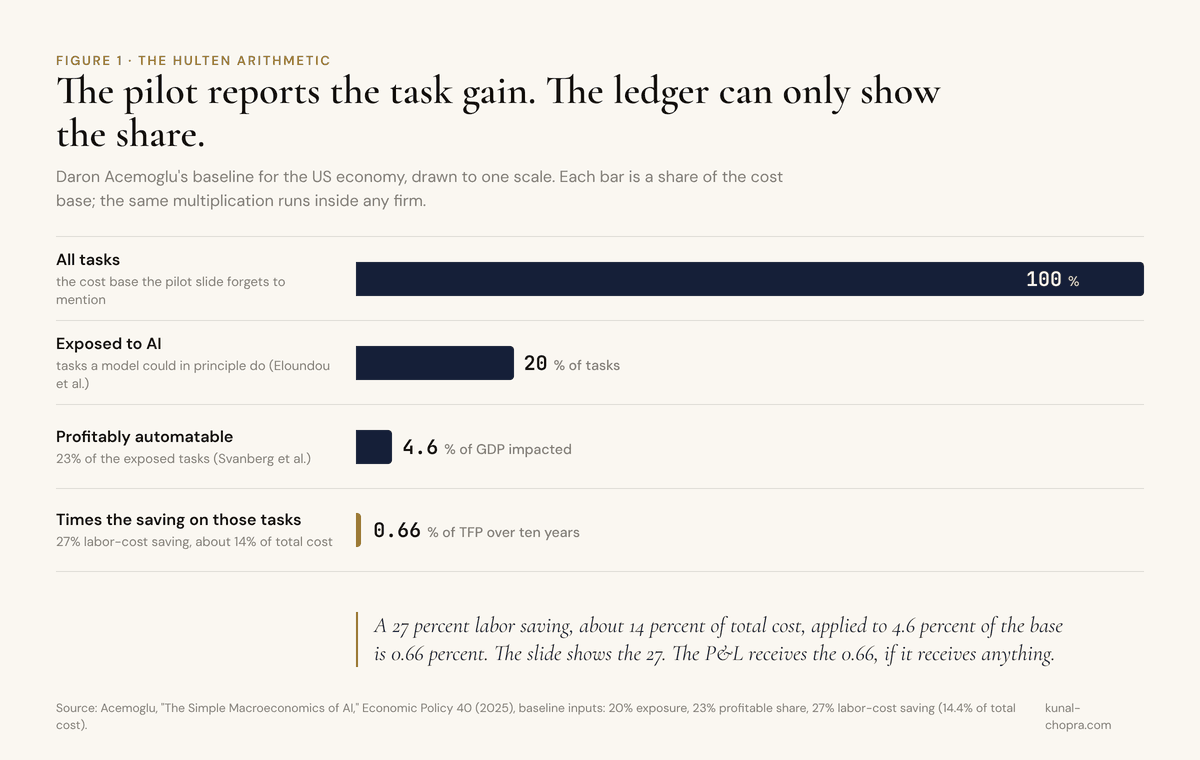
The second is share. Daron Acemoglu's account of the macroeconomics of AI rests on a version of Hulten's theorem: when AI works through task-level cost savings, the aggregate gain is the share of costs the affected tasks represent multiplied by the average saving on those tasks. His baseline multiplies roughly 4.6 percent of GDP in profitably automatable exposed tasks by about 14 percent cost savings and lands at 0.66 percent of total factor productivity over ten years.7 The same multiplication runs inside a firm. A 27 percent speedup on a task that is 3 percent of a department's cost is a 0.8 percent change in that department's cost, before reallocation takes its cut. The pilot slide reports the 27. The ledger can only ever show the 0.8, and usually shows nothing, because 0.8 percent is inside the noise of any quarter.
Shapiro put the operator's version of this to the panel. It is easy to measure how much faster he can write a paper with AI. It is hard to value being able to write a much bigger paper.1 The first is a task gain with nowhere to land. The second is a change in what gets produced, and that is a decision.
Self-report fails in both directions
The usual rescue is to measure the hours directly, by asking people or by instrumenting the tools. Both are weaker than they look.
METR ran a randomized trial in early 2025 in which 16 experienced open-source maintainers worked 246 real issues from their own repositories, each issue randomly assigned to allow or forbid AI tools. Developers forecast a 24 percent speedup. Afterwards they believed they had been sped up by 20 percent. The stopwatch said they took 19 percent longer.8 When METR tried to repeat the design with late-2025 tools, it could not: developers increasingly refused to work without AI, the control arm thinned, and METR published a note saying the new data was an unreliable signal of the current effect.9 Perceived and measured speed diverged by roughly 40 points, and then the instrument broke because the behavior it measured became universal.
Tool telemetry has the opposite problem: it is precise about the wrong quantity. GitHub's own guidance on its Copilot metrics tells administrators that acceptance rate shows whether suggestions are trusted, that differences in team composition and project complexity can drive the engaged-versus-passive comparison as much as the tool does, and that the adoption multiplier should not be treated as a standalone measure of productivity.10 That is a vendor telling its customers that its dashboard measures activity, not output. The vendor is right.
So Buluswar's three levels are also three measurement regimes. At the fluency level there is nothing to measure. At the microproductivity level there is activity to count in aggregate, but no attribution, because the saved time has no ledger line and self-report carries a documented 40-point bias. At the decision level the measurement already exists, because the decision was being priced before the model arrived.
The mechanism of attribution
Strip the word "attribution" to what a CFO and an auditor mean by it and three conditions fall out.
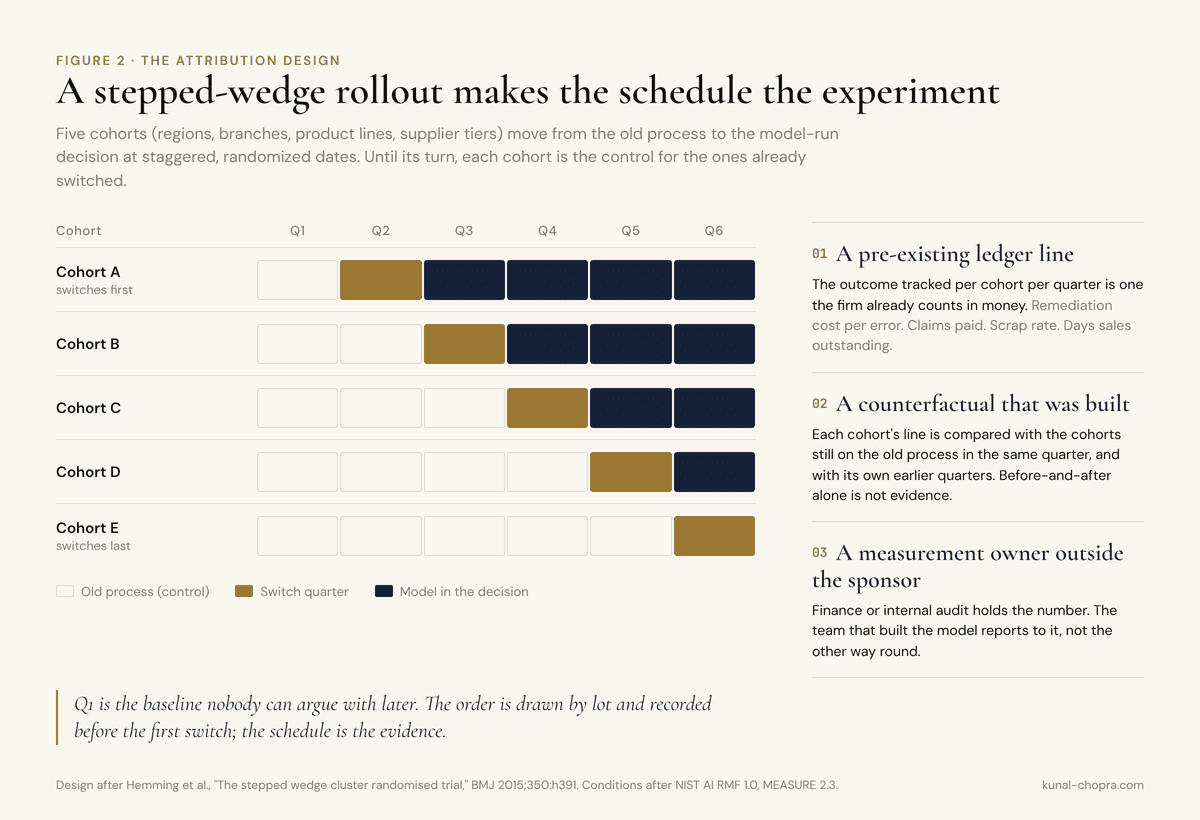
A pre-existing ledger line. The outcome the model changes must already be counted, in money, by someone whose job depends on that count. Remediation cost per error. Chargebacks. Days sales outstanding. Scrap rate. Claims paid. If the outcome has to be invented for the pilot, it is not attributable; it is a proxy, and proxies drift toward whatever makes the pilot look good.
A counterfactual that was built, not inferred. The firm needs to know what the line would have done without the model, and before-and-after comparison is not knowledge. The design the field uses when it cannot randomize individuals and cannot hold back a tool forever is the stepped-wedge rollout: units cross from control to treatment at randomized times until every unit is treated, so every unit serves as its own control and the roll-out schedule itself is the experiment. Karla Hemming and colleagues describe it as a pragmatic design that reconciles robust evaluation with political or logistical constraints,11 which is a fair description of any enterprise AI program. Regions, branches, product lines or supplier tiers are the natural clusters. The CFO fixes the schedule before the first switch, the order of cohorts is drawn at random and recorded, and the schedule itself becomes the evidence.
A measurement owner outside the sponsor. NIST's AI Risk Management Framework separates the MEASURE function from everything else for a reason: it requires that system performance or assurance criteria be measured and demonstrated under the conditions the system will see, by people who own the measurement rather than the deployment.12 Buluswar's framing was the same from the operator's side: success defined through the CEO, the CFO and the head of audit together, not by the team that built the thing.1
The worked example
Take the case Buluswar used. Banks are fined, by his count, two to four billion dollars a year for operational mistakes, and remediation costs more than the fines. A control that reads every customer claim against the applicable regulation and against the transaction record can now detect errors in near real time with full coverage, instead of sampling after the fact.1
Run that through the three conditions. The ledger line exists: remediation cost and fine exposure were on the risk committee's page before anyone said "model." The counterfactual can be built: claim types or regions can be moved onto the automated control in a randomized sequence over two or three quarters, with the detection rate, the time-to-remediation and the remediation cost per error tracked per cohort against the cohorts still on the old process. The measurement owner exists: audit already attests to those numbers. When the program is finished, the CFO has a line that moved, a schedule that shows it moved when the model arrived and not before, and an attestation. That is a return.
Now put the same bank's general-purpose assistant, rolled out to forty thousand desks, through the same conditions. The ledger line does not exist; "hours saved" is not an account. The counterfactual cannot be built once everyone has the tool and nobody will give it back, which is exactly what ended METR's second experiment. The measurement owner is the team that bought the licenses. Nothing about that spend is wrong. It is a capability investment, and it should be approved as one, with capability metrics: adoption, depth of use, the share of workflows redesigned around it. In McKinsey's 2026 survey, nearly three-quarters of high performers report having fundamentally redesigned workflows, against one-quarter of everyone else,5 which measures whether a firm is moving work toward the decision level, not whether it has earned a return.
The objection
The strongest case against this position comes from Brynjolfsson, Daniel Rock and Chad Syverson. Their productivity J-curve argues that a general-purpose technology requires large complementary investments in process redesign, training and organizational capital, that those investments are intangible and uncounted, and that measured productivity therefore dips before it rises. Adjusting for intangibles tied to computing, they put US total factor productivity 15.9 percent above the official measure by 2017.13 On that view, insisting on attribution now starves the very investment that produces attributable returns later, and the CFO who demands a ledger line in year one is repeating the mistake of the managers who could not see the computer age in the statistics.
The objection is right about the investment and wrong about the accounting. The J-curve says the intangible capital is real and should be built. It does not say the firm should book a return on it before the return exists. Those are different claims, and conflating them is how the hours-saved slide gets made. The discipline I am arguing for funds the fluency and microproductivity layers explicitly, as the intangible investment they are, with a stated expectation that their payoff arrives when a big rock gets moved and is measured there. What it refuses is the arithmetic that converts a survey answer into EBIT. Buluswar's own line about banks and the Citi work was that the first job was detection, and that redesigning the product so the error cannot happen is the next level up.1 That is a J-curve, drawn by an operator: fund the capability, measure at the decision.
What this means for the CEO and the CFO
Three decisions follow, and each one is specific.
Split the AI budget into two lines with two approval tests. Capability spend (tools for everyone, training, the data work that makes any of it possible) is approved on adoption and workflow-redesign metrics, with no ROI claim attached and none accepted. Decision spend is approved only with a named ledger line, a rollout schedule that produces a counterfactual, and a measurement owner outside the sponsoring team. If a proposal cannot name the line, it is capability spend, whatever the slide says.
Refuse the multiplication. Hours times headcount times wage is not a return, and a CFO who signs it is signing a number the auditor will not. The case against it is a randomized trial with a 40-point perception gap and a national register showing where the saved hours went.
Sequence the big rocks so the schedule is the experiment: eight to ten decisions, each with an existing line, each rolled out in cohorts on a schedule fixed in advance with the order drawn by lot. Two years on, that firm has eight to ten lines that moved on schedule, and a board that can tell an AI program from a story about one.
The fastest way to find out whether a company's AI program is real is to ask its CFO which account moved. If the answer is a survey, the program is at level one or two, and that is fine, as long as nobody is booking it as level three.
— Kunal
Sources
- Chicago Booth Magazine, "What AI Can and Cannot Do for Business," Fall 2026, pp. 36–41. An edited transcript of Bradley Shapiro in conversation with Murli Buluswar, MBA '01, and Suzanne El-Moursi, MBA '12, at the James M. Kilts Center's Ann Mukherjee Marketing Summit, April 2026 ("Driving Growth with AI: Augment, Automate, or Transform?"). https://www.chicagobooth.edu/research/kilts/events/amsummit↩
- Erik Brynjolfsson, Danielle Li and Lindsey Raymond, "Generative AI at Work," Quarterly Journal of Economics 140, no. 2 (2025): 889–942; preprint arXiv:2304.11771. https://arxiv.org/abs/2304.11771↩
- Anders Humlum and Emilie Vestergaard, "Large Language Models, Small Labor Market Effects," Becker Friedman Institute Working Paper 2025-56 (NBER Working Paper 33777), May 2025. https://bfi.uchicago.edu/wp-content/uploads/2025/04/BFI_WP_2025-56-3.pdf↩
- Alexander Bick, Adam Blandin and David Deming, Generative Artificial Intelligence Adoption Tracker, Real-Time Population Survey, via FRED series RPSGENAITSALL (time savings as a share of work hours; Q2 2026 value 2.17 percent) and the FRED Blog, "Does generative AI save time at work?", August 2026. Underlying paper: "The Rapid Adoption of Generative AI," Management Science (2026). https://fred.stlouisfed.org/series/RPSGENAITSALL↩
- McKinsey & Company, "The state of AI," Global Survey published 25 August 2026 (fielded 4 May to 8 June 2026; 1,719 respondents in 97 nations). https://www.mckinsey.com/capabilities/quantumblack/our-insights/the-state-of-ai↩
- Robert M. Solow, "We'd Better Watch Out," New York Times Book Review, 12 July 1987, p. 36.↩
- Daron Acemoglu, "The Simple Macroeconomics of AI," Economic Policy 40, no. 121 (2025): 13–58; NBER Working Paper 32487 (May 2024). https://economics.mit.edu/sites/default/files/2024-05/The%20Simple%20Macroeconomics%20of%20AI.pdf↩
- Joel Becker, Nate Rush, Beth Barnes and David Rein, "Measuring the Impact of Early-2025 AI on Experienced Open-Source Developer Productivity," METR, 10 July 2025; arXiv:2507.09089. https://metr.org/blog/2025-07-10-early-2025-ai-experienced-os-dev-study/↩
- METR, "We are Changing our Developer Productivity Experiment Design," 24 February 2026. https://metr.org/blog/2026-02-24-uplift-update/↩
- GitHub Docs, "Interpreting Copilot usage metrics," Copilot usage metrics reference, 2026. https://docs.github.com/en/copilot/reference/copilot-usage-metrics/interpret-copilot-metrics↩
- Karla Hemming, Terry P. Haines, Peter J. Chilton, Alan J. Girling and Richard J. Lilford, "The stepped wedge cluster randomised trial: rationale, design, analysis, and reporting," BMJ 350 (2015): h391. https://www.bmj.com/content/350/bmj.h391↩
- National Institute of Standards and Technology, Artificial Intelligence Risk Management Framework (AI RMF 1.0), NIST AI 100-1, January 2023, section 5.3 (MEASURE) and Table 3, MEASURE 2.3. https://nvlpubs.nist.gov/nistpubs/ai/NIST.AI.100-1.pdf↩
- Erik Brynjolfsson, Daniel Rock and Chad Syverson, "The Productivity J-Curve: How Intangibles Complement General Purpose Technologies," American Economic Journal: Macroeconomics 13, no. 1 (2021): 333–372. https://www.aeaweb.org/articles?id=10.1257/mac.20180386↩
Boring AI
AI for manufacturers, operators and service businesses — not startups chasing hype. Every other week.
Your address is used only to send this newsletter. No sharing, no selling, no tracking pixels. Unsubscribe from any issue.