Chapter 7
Five companies: how the same levers land differently
Five composite businesses, chosen to cover the lever space rather than to be interesting. Each gets the same page: the shape at close, the public companies that show the shape in filings, the four or five levers that carry its bridge, the bridge itself, and the trap that catches owners of that kind of company.
Chapter 7 of 10Five companies17 min
The composites are illustrative. Every number in them is a modeling assumption to be replaced with an acquired company's own, and the bridges are built from the lever ranges in the six lever chapters, not the other way round. The public reference points beside each composite are real and cited; they are there so that a reader can check the shape against a filing rather than take it from me. Where a lever's card grades the evidence weak, the bridge uses the low end of its range.
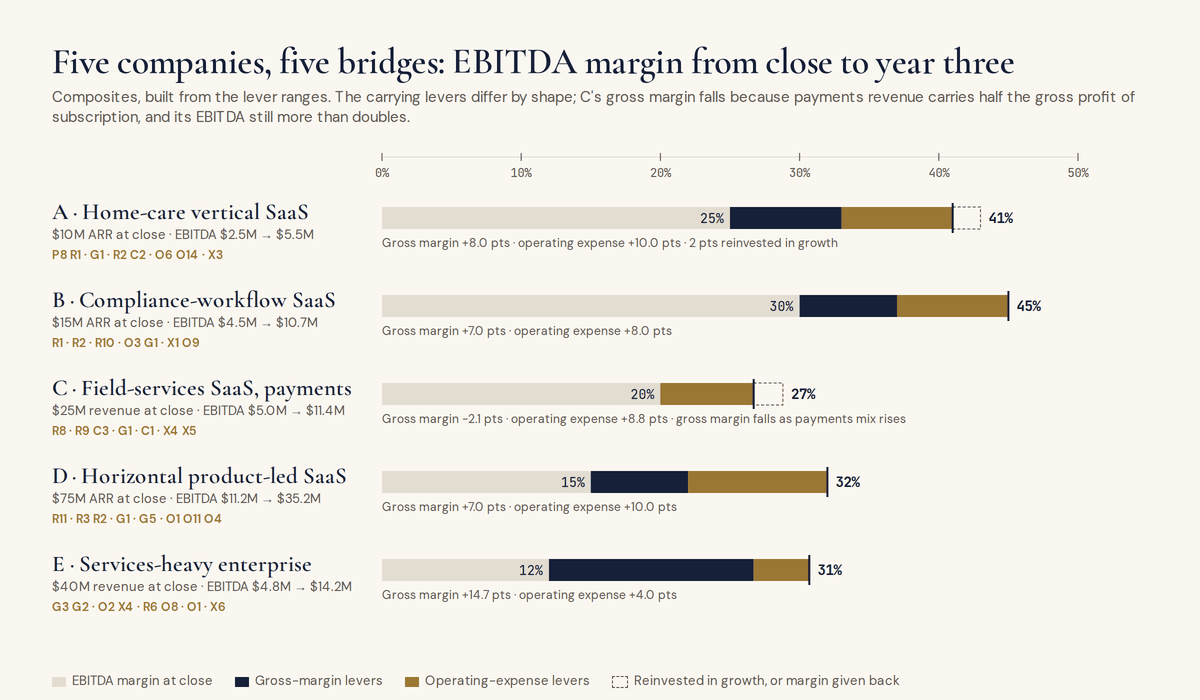
The five were picked so that each of the six lever groups carries at least one bridge. A is the small regulated vertical, where pricing, support and the customer's revenue cycle carry it. B is the compliance-workflow company, where the data rights and the content are the asset. C is the vertical platform with a payments rail, where the fintech levers carry it and the gross-margin arithmetic runs the other way. D is the horizontal product-led company at scale, where self-serve conversion, the pricing migration and inference cost decide it. E is the services-heavy enterprise business, where implementation and services margin are the whole plan.
A · The home-care vertical SaaS
The shape at close. Founder-owned software for post-acute and community-based care agencies: $10M of ARR growing 8% to 10%, 92% gross retention, 101% net, 60 people, 25% EBITDA, per-user pricing unchanged since 2021, a twelve-year-old codebase with a modern front end, eight people in support answering 2,200 tickets a month, implementation billed hourly at a loss, a twelve-day close and 55 days of DSO. A business associate under HIPAA whose customers are covered entities.
What it looks like in public. The category's public reference is WellSky's April 2026 launch of ambient documentation for personal care, with agencies reporting care-plan documentation "from up to three hours to approximately one hour per client," a vendor's anonymous figure that sets the shape of the R2 module.1 The customer's problem is measured by KFF (appeal overturn rates of 43% to 67%) and by the HFMA survey finding 64% of large health systems piloting or implementing revenue-cycle AI against about 20% of small ones; the agencies this company serves are the 20%.2
The levers that carry the bridge. R1 and P8 (six points of cumulative price on a base priced in 2021, flowing through at 90%); G1 (support from 10% to 5% of revenue, eight people to four through attrition); R2 with C2 (documentation, authorizations and appeals as paid modules, 45% attach, about $1.2M of ARR); O6 with O14 (finance from four people to two, G&A from 15% to 10%); and X3 (the business associate boundary, the retention terms and the de-identification standard, without which none of the above may touch a record).
The bridge.
| Line | Close $M | Close % | Year 3 $M | Year 3 % | Margin pts |
|---|---|---|---|---|---|
| Revenue | 10.00 | 100% | 13.55 | 100% | |
| Hosting and platform | 0.70 | 7.0% | 0.81 | 6.0% | +1.0 |
| Other COGS | 0.10 | 1.0% | 0.14 | 1.0% | 0 |
| Support and success | 1.00 | 10.0% | 0.68 | 5.0% | +5.0 |
| Professional services | 0.50 | 5.0% | 0.41 | 3.0% | +2.0 |
| Gross profit | 7.70 | 77.0% | 11.51 | 85.0% | +8.0 |
| Sales and marketing | 1.40 | 14.0% | 2.17 | 16.0% | −2.0 |
| R&D | 2.30 | 23.0% | 2.44 | 18.0% | +5.0 |
| G&A | 1.50 | 15.0% | 1.36 | 10.0% | +5.0 |
| EBITDA | 2.50 | 25.0% | 5.54 | 41.0% | +16.0 |
Revenue grows from $10.0M to $13.55M through price ($0.7M), retention ($0.4M), modules ($1.2M) and new logos ($1.25M). Headcount moves from 60 to 52 while revenue grows 35%. DSO from 55 to 38 days releases about $630,000 of working capital. The full function-by-function treatment is the case study.
The trap. Automating before pricing: the migration agent ships, implementation gets cheaper to deliver, and the company keeps billing it by the hour. The second trap is the provider agreement: a covered endpoint and zero data retention cannot both be true on one organization, and a plan that assumes both has a compliance fact wrong from day one.
The exit. From a 34 on the Rule of 40 to a 52, with 45% of customers on paid AI modules and a usage component in the revenue, which is the product-embedded profile McKinsey's data says earns the premium and the seat-exposure profile a buyer's P4 will find low.
B · The compliance-workflow SaaS
The shape at close. Software that manages a regulated obligation for its customers, product or supply-chain compliance, financial reporting, quality, privacy, with a team of twelve regulatory analysts in cost of goods maintaining the rules and content. $15M of ARR growing 15%, 95% gross retention, 108% net, 90 people, 30% EBITDA, enterprise buyers who send a security questionnaire before every contract, and customer agreements that are silent on whether the company may learn from the submissions it processes.
What it looks like in public. Workiva's second quarter of fiscal 2026 is the shape at maturity: 97% gross retention, 111% net retention, revenue up 19%, and premium tiers priced "north of 20%" above the standard, with the regulatory drivers named on the call.3 Veeva's fiscal 2026, at $3.2B of revenue and a 44.9% non-GAAP operating margin in a single regulated vertical, is what the margin structure becomes.4 The transaction record shows the dispersion a buyer will find: compliance and GRC software has traded from 3.7x revenue to about 15x ARR in 2024 to 2026, and one asset re-rated from 9 to 10 times EBITDA in 2022 to 18 to 20 times in 2025 with the same business inside it.5 Certivo, the company I run, is a compliance-workflow business of this kind built AI-native from the start, and the one thing I would tell an acquirer of a traditional one is that the register of agents, which one exists, who owns it, what it may touch and what it last passed, turned out to matter more than any single agent, because it is the artifact a regulated customer's auditor asks to see.
The levers that carry the bridge. R1 (tiers where the premium tier carries the regulatory updates, the price of not falling behind); R2 (the determination itself, drafted by the product and signed by the customer, which is also X2's sign-off point); R10 (the cross-customer benchmark, inside the rights P2 counted and X3 fixed at renewal); the content team reshaped (O3 and G1 together: analysts become reviewers of a rules engine that agents keep current, the team from twelve to eight with four redeployed to product); and X1 with O9, because the company's own compliance posture is its product's credibility and the questionnaire is its sales cycle.
The bridge.
| Line | Close $M | Close % | Year 3 $M | Year 3 % | Margin pts |
|---|---|---|---|---|---|
| Subscription ARR | 15.00 | 100% | 23.10 | 97.0% | |
| Data products | 0 | 0% | 0.71 | 3.0% | |
| Revenue | 15.00 | 100% | 23.82 | 100% | |
| Hosting | 0.60 | 4.0% | 0.83 | 3.5% | +0.5 |
| Regulatory content team | 1.20 | 8.0% | 1.19 | 5.0% | +3.0 |
| Support and success | 1.05 | 7.0% | 1.07 | 4.5% | +2.5 |
| Professional services | 0.45 | 3.0% | 0.48 | 2.0% | +1.0 |
| Gross profit | 11.70 | 78.0% | 20.24 | 85.0% | +7.0 |
| Sales and marketing | 2.70 | 18.0% | 4.05 | 17.0% | +1.0 |
| R&D | 2.70 | 18.0% | 3.57 | 15.0% | +3.0 |
| G&A | 1.80 | 12.0% | 1.91 | 8.0% | +4.0 |
| EBITDA | 4.50 | 30.0% | 10.72 | 45.0% | +15.0 |
Revenue compounds at 15%, 17% and 18% as the determination module attaches and the premium tier takes hold. The content team's cost falls as a share of revenue while its headcount falls by a third, not by two-thirds, because a rules engine that nobody reviews is a hallucinated regulation waiting to be sold.
The trap. Cutting the content team before the rules engine is proven, and discovering the moat was the reading, not the rules. The honest version of the argument runs the other way too: regulatory content moats were built on the cost of reading and structuring primary sources, which is the task models cheapen, so the buyer should re-underwrite the moat rather than assume it. In Europe the demand side moved in 2026 as well: the CSRD threshold rose to more than 1,000 employees and €450M of turnover, removing most previously in-scope companies, while US state-level product and PFAS rules kept fragmenting; fragmentation is better for this business than harmonization, and a buyer should know which way the vertical's rules are moving.6
The exit. A regulated-workflow multiple defended with 97%-type retention, tier pricing power and a data product the buyer can see the rights for.
C · The field-services vertical SaaS with payments
The shape at close. Software for 12,000 small field-service businesses (HVAC, plumbing, landscaping, pest control) that quote, schedule, dispatch and invoice through it: $25M of revenue, $22M subscription and $3M payments, growing 12%, 20% EBITDA, 180 people, 12% of customers' roughly $6B of aggregate annual invoice volume running through the platform's referral arrangement with a processor, at about 42 basis points of gross revenue and 40% gross margin on that line. Support is 12% of revenue because small merchants call.
What it looks like in public. ServiceTitan's fiscal 2025 is the category leader's shape: usage revenue of $173.8M on $771.9M of total, 22.5%, against $68.5B of gross transaction volume, about 25 basis points, with the take rate "roughly constant at 0.25% over time."7 EverCommerce's 2025 10-K is the closest thing to a sponsor-owned roll-up in this space: payments "approximately 20% of revenue," $13.0B of annualized processed volume against "an aggregate annualized payment opportunity exceeding $100 billion," about 13% penetration, on 4.8% revenue growth; the attach lever is where the value sits, not the software line.8 Toast is the disclosure to model on: 49 basis points of net payments take, fintech gross margin of roughly 36% against 79% for SaaS, and Toast Capital contributing $58M of gross profit and 11 basis points in a single quarter.9 Procore and Weave are the two counterexamples on the R8 card, one where payments never appeared in the P&L and one where they did and net retention still sits at 93%.10
The levers that carry the bridge. R8 (attach from 12% to 40% of a growing volume base, take from 42 to 50 basis points, facilitator-lite terms in year two once volume justifies it); R9 and C3 (capital advances and instant payouts through a partner that carries the balance sheet); G1 (support from 12% to 4.5% of subscription revenue, the largest absolute support saving of the five); C1 (card-billed subscriptions with the account updater and retry logic, the boring plumbing that beats the model); and X4 with X5 (each add-on brings merchants to the rail, and each is read in full before the letter of intent).
The bridge.
| Line | Close $M | Close % | Year 3 $M | Year 3 % | Margin pts |
|---|---|---|---|---|---|
| Subscription ARR | 22.00 | 88.0% | 27.45 | 64.5% | |
| Payments | 3.00 | 12.0% | 15.12 | 35.5% | |
| Revenue | 25.00 | 100% | 42.57 | 100% | |
| Hosting | 1.25 | 5.0% | 1.24 | 2.9% | +2.1 |
| Payments processing | 1.80 | 7.2% | 8.47 | 19.9% | −12.7 |
| Support and success | 3.00 | 12.0% | 1.92 | 4.5% | +7.5 |
| Professional services | 0.50 | 2.0% | 0.41 | 1.0% | +1.0 |
| Gross profit | 18.45 | 73.8% | 30.53 | 71.7% | −2.1 |
| Sales and marketing | 6.25 | 25.0% | 9.37 | 22.0% | +3.0 |
| R&D | 4.50 | 18.0% | 6.39 | 15.0% | +3.0 |
| G&A | 2.70 | 10.8% | 3.41 | 8.0% | +2.8 |
| EBITDA | 5.00 | 20.0% | 11.38 | 26.7% | +6.7 |
Read this bridge on gross profit, not on margin. EBITDA more than doubles, from $5.0M to $11.4M, while the EBITDA margin moves only seven points and the gross margin percentage falls, because a dollar of payments revenue carries less than half the gross profit of a dollar of subscription. Payments volume on the platform goes from $0.72B to about $3.0B. A buyer who values this company on EV to revenue will underprice it; one who values it on EV to gross profit and net take in basis points, which is how Toast reports itself, will see it.
The trap. Becoming a payment facilitator too early. Every source puts the build at twelve to twenty-four months and low seven figures, one processor's own account puts break-even above about $2B of annual volume with roughly 5 basis points a year lost to fraud and chargebacks, and no major provider publishes the referral-versus-facilitator revenue share at all.11 The second trap is counting payments as revenue growth before counting its gross margin; the third is Shopify Capital's, where originations grew 40% in a year while the share of deals current fell from 93.7% to 91.9%, which is a credit box loosening and the balance-sheet risk a software buyer underwrites worst.12
The exit. An EV-to-gross-profit story, with net take in basis points, attach as a share of eligible volume, and the facilitator decision either made or deliberately deferred with the volume threshold written down.
D · The horizontal product-led SaaS
The shape at close. A collaboration or workflow product sold by the seat to knowledge workers, 60% self-serve: $75M of ARR growing 12%, net retention at 100%, 400 people, 15% EBITDA, 78% gross margin before any AI product, a large support desk and a large IT desk, and the highest AI exposure on the map, because its seats sit in exactly the roles agents compress and its interface is the kind a model can replace.
What it looks like in public. HubSpot's second quarter of 2026 is the whole card in one call: a customer agent resolving "72% of support tickets without human escalation," more than 55% of Pro-and-above customers using agents, outcome-based pricing introduced and entry prices lowered, and net customer additions cut to 5,000 to 6,000 a quarter on "weaker conversion rates and increased buyer hesitancy."13 Atlassian's Rovo adopters grow ARR "more than 2x faster than non-adopters," on a self-selected base, and its agents consume "48% fewer tokens" on its knowledge graph.14 Figma reported 85% non-GAAP gross margin, up 2.5 points sequentially, while shipping AI hard, with more than 80% of its larger customers using AI credits weekly and about two-thirds of renewals adding full seats.15 Growth Unhinged's 2026 survey puts hybrid pricing at 37% of companies, AI credits at 29% with another 33% planning them, and 70% of AI spend coming out of existing technology budgets, which says the wallet is not growing.16 Meritech's finding that the AI-tailwind bucket of public software fell harder than the rest in 2026 is the multiple's side of the same story.17
The levers that carry the bridge. R11 (trial-to-paid conversion up 30%, a fifth more new ARR closed without a sales touch); R3 with R2 (the migration to seat-plus-credits, executed cohort by cohort with HubSpot's quarter as the warning, so that credits reach 28% of revenue without the funnel narrowing); G1 (support from 10% to 5% of revenue at the 72% resolution the public data supports); G5 (inference held inside a hosting line that falls from 10% to 9% of revenue while the AI product grows, through routing, retrieval and first-party models, the three levers Figma named); and O1 with O11 and O4 (R&D from 20% to 17%, sales and marketing from 33% to 28%, the largest desks on the map resolved by agent).
The bridge.
| Line | Close $M | Close % | Year 3 $M | Year 3 % | Margin pts |
|---|---|---|---|---|---|
| Seat subscriptions | 75.00 | 100% | 79.29 | 72.0% | |
| AI credits and usage | 0 | 0% | 30.83 | 28.0% | |
| Revenue | 75.00 | 100% | 110.12 | 100% | |
| Hosting and inference | 7.50 | 10.0% | 9.91 | 9.0% | +1.0 |
| Support and success | 7.50 | 10.0% | 5.51 | 5.0% | +5.0 |
| Professional services | 1.50 | 2.0% | 1.10 | 1.0% | +1.0 |
| Gross profit | 58.50 | 78.0% | 93.61 | 85.0% | +7.0 |
| Sales and marketing | 24.75 | 33.0% | 30.83 | 28.0% | +5.0 |
| R&D | 15.00 | 20.0% | 18.72 | 17.0% | +3.0 |
| G&A | 7.50 | 10.0% | 8.81 | 8.0% | +2.0 |
| EBITDA | 11.25 | 15.0% | 35.24 | 32.0% | +17.0 |
Revenue compounds at 12%, 14% and 15% as credits attach; seat revenue grows only 6% over three years, which is the seat compression happening inside a growing company rather than instead of it. The bridge holds only if G5 holds: at a 50% gross margin on the AI product, the credit line adds $15M of gross profit; at 30%, it adds $9M and the margin story is gone.
The trap. Inference eating the margin the AI product creates, and the pricing migration narrowing the funnel. Both are visible in public filings in the same year, and both have kill criteria on their cards. The a16z view that an 85% gross margin is "an orange flag" and the buyer's view that it is what software is graded on are both true for this company, and the exit story has to reconcile them with numbers.18
The exit. The seat-exposure story told with data: the share of ARR in agent-compressible roles falling below a quarter, the credit line's gross margin disclosed, and a Rule of 40 that moved from 27 to 47 on margin and growth together.
E · The services-heavy enterprise software company
The shape at close. Core software for a regulated industry, insurance, utilities, public sector, sold to large customers on long cycles, assembled from three prior acquisitions with three codebases: $40M of revenue, $26M subscription at 75% gross margin and $14M of implementation and configuration services at 15%, growing 6%, 12% EBITDA, 220 people, of whom 90 are in services delivery. Implementation takes nine to fifteen months and is where the customer decides whether to renew.
What it looks like in public. Guidewire's fourth quarter of fiscal 2026 is the shape exactly: "Services' gross margin was 12.5% compared with 12.9% a year ago," against "Subscription and support gross margin was 74.5%, up 4 percentage points," with an "AI-powered project harness for implementations" that the company says is "delivering on the promise of material reduction in project complexity and duration," a claim with no number attached yet, and partners expected to offer "fixed bid componentry ... as they get more confident in their tooling."19 Workday's Deployment Agent is "designed to deliver an estimated 30% reduction in implementation hours and costs" with a 50% target, and in the same quarter Workday guided professional services revenue down, which is what success looks like from the top line.20 Google's migration paper and the PitchBook add-on data are the platform side: 80% of code changes in a large migration AI-authored, the bottleneck moved to reviewers, and add-ons now about 45% of software deal value.21
The levers that carry the bridge. G3 with G2 (implementation from nine to fifteen months toward four to six, bundled into subscription for new customers and repriced at renewal for existing ones, services from 35% of revenue toward 22% and from 15% to 35% gross margin); O2 with X4 (the three codebases become one, with senior reviewers reserved for it and the acquired stacks retired, which is also where G4's hosting saving comes from); R6 with O8 (the proposal, the questionnaire and the bespoke paper are the sales cycle, and each is compressed); O1 (a large engineering organization where the gates matter more than the tools); and X6 (the mix story told so that shrinking services revenue reads as improvement, because it is).
The bridge.
| Line | Close $M | Close % | Year 3 $M | Year 3 % | Margin pts |
|---|---|---|---|---|---|
| Subscription | 26.00 | 65.0% | 36.20 | 78.4% | |
| Services | 14.00 | 35.0% | 10.00 | 21.6% | |
| Revenue | 40.00 | 100% | 46.20 | 100% | |
| Subscription COGS | 6.50 | 16.2% | 7.96 | 17.2% | −1.0 |
| Services delivery | 11.90 | 29.8% | 6.50 | 14.1% | +15.7 |
| Gross profit | 21.60 | 54.0% | 31.73 | 68.7% | +14.7 |
| Sales and marketing | 6.40 | 16.0% | 6.93 | 15.0% | +1.0 |
| R&D | 6.40 | 16.0% | 6.93 | 15.0% | +1.0 |
| G&A | 4.00 | 10.0% | 3.70 | 8.0% | +2.0 |
| EBITDA | 4.80 | 12.0% | 14.18 | 30.7% | +18.7 |
Total revenue grows only 15% over three years, because $4M of services revenue is deliberately converted or retired while subscription grows 39%. EBITDA nearly triples. Almost all of the margin comes from one line, services delivery, and the ninety people in it move to sixty, half by attrition and a quarter each by redeployment to product and to the reviewer pool the migrations need.
The trap. Cutting services revenue before subscription replaces it, which turns a mix improvement into a shrinking company; and the reviewer bottleneck, which is the scarce resource in every migration Google measured and the one a sponsor-backed integration usually borrows from the roadmap. A quieter trap is the exit narrative: a buyer's model that reads the top line without the mix will see 5% growth and a services business.
The exit. The mix story: subscription from 65% to 78% of revenue at rising gross margin, one codebase, and a Rule of 40 that moved from 18 to 45 almost entirely on margin, which is where SEG's data says the multiple moves below the 10x line.22
Reading the five together
Four things hold across all five. The bridge is carried by four or five levers, never by fourteen. The carrying levers are set by the company's shape at close, which P1 through P4 establish before the price is set. The Invent lever in each bridge (modules in A, the determination and the benchmark in B, payments in C, credits in D, productized configuration in E) is the one that changes the multiple rather than the margin, and it depends on rights and foundations built earlier. And the trap in each is a sequencing error: automating before pricing, cutting content before proving the engine, facilitating before volume, migrating pricing before the funnel is measured, cutting services before subscription replaces them. The order is the playbook.
Sources
- WellSky, "WellSky launches AI-powered ambient documentation for personal care," April 30, 2026. https://wellsky.com/wellsky-launches-ai-powered-ambient-documentation-for-personal-care-enabled-by-automynd/ (V, anonymous)↩
- KFF, "Prior Authorization Metrics Provide New Insights," August 13, 2026, https://www.kff.org/patient-consumer-protections/prior-authorization-metrics-provide-new-insights-into-insurer-practices-but-gaps-remain/ (I); Fierce Healthcare on the HFMA/AKASA survey, December 17, 2025, https://www.fiercehealthcare.com/ai-and-machine-learning/adoption-ai-hospital-rcm-surges-even-health-systems-navigate-cost (I)↩
- Workiva Q2 fiscal 2026 earnings call, August 4, 2026. https://www.fool.com/earnings/call-transcripts/2026/08/11/workiva-wk-q2-2026-earnings-call-transcript/ (I, public company)↩
- Veeva, fiscal 2026 results, March 4, 2026. https://www.prnewswire.com/news-releases/veeva-announces-fourth-quarter-and-fiscal-year-2026-results-302704492.html (I, public company)↩
- MA Insights, "GRC SaaS platforms: transaction multiples and consolidation trends," February 6, 2026; individual multiples are press-derived estimates. https://www.mainsights.io/articles/grc-saas-platforms-transaction-multiples-and-consolidation-trends (I, aggregator)↩
- Latham & Watkins, "EU Sustainability Omnibus Published in the Official Journal," February 27, 2026, https://www.lw.com/en/insights/eu-sustainability-omnibus-published-in-the-official-journal (I, statute via law firm); Assent, "What's Shaping Product Compliance & Sustainability in 2026?", December 23, 2025, https://www.assent.com/blog/whats-shaping-product-compliance-and-sustainability-in-2026/ (V, regulatory roundup; each deadline independently checkable)↩
- ServiceTitan fiscal 2025 results, March 13, 2025; Wing Venture Capital and Tanay Jaipuria S-1 analyses, December 2024. https://investors.servicetitan.com/news-releases/news-release-details/servicetitan-announces-fiscal-fourth-quarter-and-full-year ; https://www.wing.vc/content/servicetitans-ipo-a-deep-dive (I)↩
- EverCommerce Form 10-K for fiscal 2025, via StockTitan filing summary; verify against EDGAR before quoting. https://www.stocktitan.net/sec-filings/EVCM/10-k-ever-commerce-inc-files-annual-report-40fc74a758a9.html (I, public company)↩
- Toast Q3 2025 prepared remarks and full-year 2025 results. https://s28.q4cdn.com/141746709/files/doc_financials/2025/q3/Q3-25-Prepared-Remarks.pdf ; https://www.businesswire.com/news/home/20260212058106/en/Toast-Announces-Fourth-Quarter-and-Full-Year-2025-Financial-Results (I, public company)↩
- Procore full-year 2025 results, https://www.procore.com/press/procore-announces-fourth-quarter-and-full-year-2025-financial-results ; Weave full-year 2025 results via Barchart, https://www.barchart.com/story/news/313943/weave-announces-fourth-quarter-and-full-year-2025-financial-results (I, public companies)↩
- Stax, updated February 7, 2025; Tilled, October 19, 2021 (mechanism only); Payroc, April 24, 2026; Adyen, "PayFac," November 20, 2025, https://www.adyen.com/knowledge-hub/payfac (V)↩
- deBanked, "Shopify Capital Finishes 2025 With $4.2B," February 18, 2026. https://debanked.com/2026/02/shopify-capital-finishes-2025-with-4-2b-in-mcas-and-business-loans/ (I, trade press)↩
- HubSpot Q2 2026 earnings call, August 12, 2026. https://www.fool.com/earnings/call-transcripts/2026/08/12/hubspot-hubs-q2-2026-earnings-call-transcript/ (I, public company)↩
- Atlassian Q4 FY26 shareholder letter, August 6, 2026. https://www.sec.gov/Archives/edgar/data/1650372/000165037226000031/teamq42026shareholderlet.htm (I, public company)↩
- Figma Q2 2026 earnings call, August 12, 2026. https://www.fool.com/earnings/call-transcripts/2026/08/12/figma-fig-q2-2026-earnings-call-transcript/ (I, public company)↩
- Growth Unhinged, "The 2026 State of B2B Monetization," May 13, 2026. https://www.growthunhinged.com/p/the-state-of-b2b-monetization-in-2026 (I)↩
- Meritech Capital, "Meritech Software Pulse," April 9, 2026. https://meritech.substack.com/p/meritech-software-pulse-09-april (I)↩
- Mostly Metrics reporting Sarah Wang of a16z, November 9, 2025. https://www.mostlymetrics.com/p/can-bad-gross-margins-ever-be-a-good-sign (I)↩
- Guidewire Q4 fiscal 2026 earnings call, September 9, 2026. https://www.fool.com/earnings/call-transcripts/2026/09/09/guidewire-gwre-q4-2026-earnings-call-transcript/ (I, public company)↩
- Workday Q1 fiscal 2027 earnings call, May 21, 2026. https://www.fool.com/earnings/call-transcripts/2026/05/21/workday-wday-q1-2027-earnings-call-transcript/ (I, public company)↩
- Nikolov et al., arXiv:2501.06972, January 2025, https://arxiv.org/abs/2501.06972v1 (I); PitchBook, June 25, 2026, https://pitchbook.com/news/articles/pe-pivots-as-platform-buyouts-in-software-fall-to-decade-low (I)↩
- Software Equity Group, 2026 Annual SaaS Report, March 2026. https://sandhill.com/wp-content/uploads/2026/03/SEG-Research-2026-Annual-SaaS-Report.pdf (I)↩
Boring AI
AI for manufacturers, operators and service businesses — not startups chasing hype. Every other week.
Your address is used only to send this newsletter. No sharing, no selling, no tracking pixels. Unsubscribe from any issue.