Playbook
The AI playbook for acquired software companies, forty-eight levers each tied to the P&L
Every lever an owner can pull between diligence and exit, in an AI-native world: what it is, which line it moves, how much the evidence supports, and what kills it. Five composite companies show how the same levers land differently. One of them is worked in full.
Hub10 chapters16 min
How to use this
This is a reference, not an argument to be read once. The hub you are on carries the perspective and the value map. Six chapters carry the levers, one group per chapter, each lever on the same card. A seventh chapter shows five composite companies and the levers that carry each of their bridges. An eighth is the full case study of one of them, a $10M home-care software company, function by function. The ninth is how to run the program, and the appendix holds the benchmarks, the glossary and every source.
If you are pricing a deal, start with Before close. If you own a bridge, start with the value map, find the four or five levers that match the company's shape, and read those cards. If you run the company, read Running it first and the case study second. Every lever has a stable identifier (R8, O6, X4) so that a card can be cited from a value creation plan, an investment memo or a board pack.
Part I. The perspective
Who this is for and what changed
It is written for the people who have to make an acquired software company worth more than it was at close: the deal team that underwrites the plan, the operating partner who owns the bridge, and the chief executive and chief financial officer who have to deliver it with the people, the codebase and the customers they inherited. It assumes a company between roughly $5M and $100M of revenue, because that is where most software buyouts now happen and where the levers change the most.
Three things have changed since the last operating playbooks were written, and they change what an owner can do rather than merely how fast.
The first is that the marginal cost of a large class of work has collapsed: reading documents, drafting, classifying, reconciling, answering questions from a known corpus, writing and migrating code under review. Functions built around that work (support, implementation, finance operations, legal review, tier-one engineering) can be resized and reorganized in a way that was not available in the last cycle. This is the Deploy and Reshape material, and most of the evidence for it is real.
The second is that the customer's own work has become addressable by the software company. A vertical platform that holds a customer's scheduling, billing or compliance data can now sell the labor around that data as product: the documentation, the authorization, the appeal, the reconciliation. This is the Invent material, and it is the only part of the program that competitors cannot copy by buying the same tools.
The third is that the deal itself has become cheaper to diligence and harder to price. The same technology that lets an owner read every customer contract and every commit in a target also degrades the asset being read, because AI-written code is duplicating faster and being refactored less, and because seat-based revenue is exposed in a way buyers now underwrite. Public software multiples fell through 2026 and the companies with AI tailwinds fell more, not less.1 Thoma Bravo's founder said in March 2026, of his firm's largest fund, "We made a mistake. And that caused us to pay too much."2 Diligence is a value lever now, and it acts before there is a P&L to move.
The P&L is the only scorecard
I have read a great many AI value creation plans for software companies and most of them share one defect. They list tools. They count pilots. They report hours saved by people who were asked whether they saved hours. What they do not do is connect the work to a line on the income statement in a way a CFO could audit. The correction is not more enthusiasm; it is a rule. Every lever in this document is defined by the line it moves and the metric that proves it, and a lever without a line is not in the catalogue.
That is a falsifiable stance. If a company runs pilots without P&L lines and still moves its margin fifteen points, the stance is wrong. The evidence so far says it does not happen. MIT's NANDA initiative reported in July 2025 that "95% of organizations are getting zero return" from generative AI, on a method I criticize in Running it, and Gartner's separate forecast points the same way: "over 40% of agentic AI projects will be canceled by the end of 2027, due to escalating costs, unclear business value or inadequate risk controls."3 In private equity specifically, FTI's 2026 survey of 555 senior leaders found 66% reporting AI-driven benefits within twelve months, up from 34% a year earlier, and only 31% describing their implementation as efficient.4 FTI's companion survey of 200 fund and operating leaders found 95% saying AI initiatives met their business case and 7% of portfolio companies using AI at enterprise scale.5 Those two figures come from the same firm in the same season. A business case that 95% of funds meet is a business case set low.
The four conditions
AI creates value in an acquired software company only when four conditions hold together.
Every initiative carries a P&L line, a measured baseline, a named owner and a kill date. The line is the account it moves. The baseline is the number on the day the plan was written, from the company's own data, not a benchmark. The owner is the function lead, never a transformation office. The kill date is when it stops if the number has not moved.
Pricing is decided before automation touches anything the customer pays for. Automating implementation before converting it from hourly fees to a subscription tier turns a revenue line into a cost saving. Shipping AI features without tiers to attach them to gives the largest lever in the document away for a cleaner org chart.
A product customers pay for ships inside twelve months of close. Internal efficiency is table stakes every competitor can buy. McKinsey's June 2026 analysis of 471 PE-backed companies found that companies that embed AI in their product or business model trade at a median revenue multiple "approximately 130 percent higher" than opportunistic users, while companies that use AI only for internal productivity trade at 14x against 13x for the opportunists; markets, in McKinsey's words, "do not materially differentiate" productivity AI from doing nothing.6 That study publishes no growth control and I say so where it is cited. The direction survives the caveat.
The three horizons run in order. Deploy is proven, purchasable tools on existing workflows, and it is where the cheap, well-evidenced savings are. Reshape is reorganizing a function because the tools changed its shape, and it is where the margin structure changes. Invent is new revenue, and it is where the multiple changes. Deploy pays for Reshape, and Reshape funds Invent. A company that stops at Deploy buys tools, saves some cost, and watches competitors buy the same tools.
The lever, defined
A lever is an intervention an owner can make that moves a specific line by a mechanism that can be stated in a sentence and checked in a quarter. "Deploy AI in support" is not a lever. "Resolve tier-one tickets with an agent measured on true resolution, and resize the support team behind it" is a lever, with a line (support and success cost of goods), a mechanism (resolution without a human), a metric (true resolution rate, cost per ticket) and a kill criterion (resolution below 40% at six months, or CSAT below baseline).
Every card in the six lever chapters has the same fields: what the lever is, the line it moves, the typical range with an evidence grade and the two or three anchor figures behind it, the conditions that must hold for it to work, the kill criteria, the metrics at close and at years one and three, the horizon and the stage at which it opens, and a strip showing how it translates across the five companies in Part V.
Some levers are old and AI changes their cost: pricing, collections, add-on integration. Some are new: an AI-paid product, data rights as an underwritten asset, agent-resolved support. The catalogue treats both alike, because the reader's question is the same for both: which line, how much, by when, and how would I know it is not working.
The evidence grades
The playbook necessarily leans on vendor case studies, because vendors are the ones measuring their own deployments. Every figure is graded. Strong means an independent study, a regulator, a statute, a primary filing or a primary press release with a stated method. Medium means a vendor case study with a named customer, or an independent figure that reached me through a secondary outlet. Weak means a vendor claim without a named customer, or a mechanism that is argued rather than measured. A lever's grade is the best evidence for its mechanism, not for any particular number, and a lever graded weak stays in the catalogue with the grade on it, because the honest statement "nobody has measured this yet" is more useful to an operator than silence.
Several widely repeated figures did not survive checking and are named where they would otherwise have appeared: the "Gartner 20 to 30% ticket deflection" benchmark that no Gartner document contains, the vendor deflection percentages absent from the pages that supposedly carry them, the payments-versus-subscription multiple ranges that trace to a banker's marketing page, and the growth band in one valuation table that inverts because of sample noise.
The deal lifecycle as the second axis
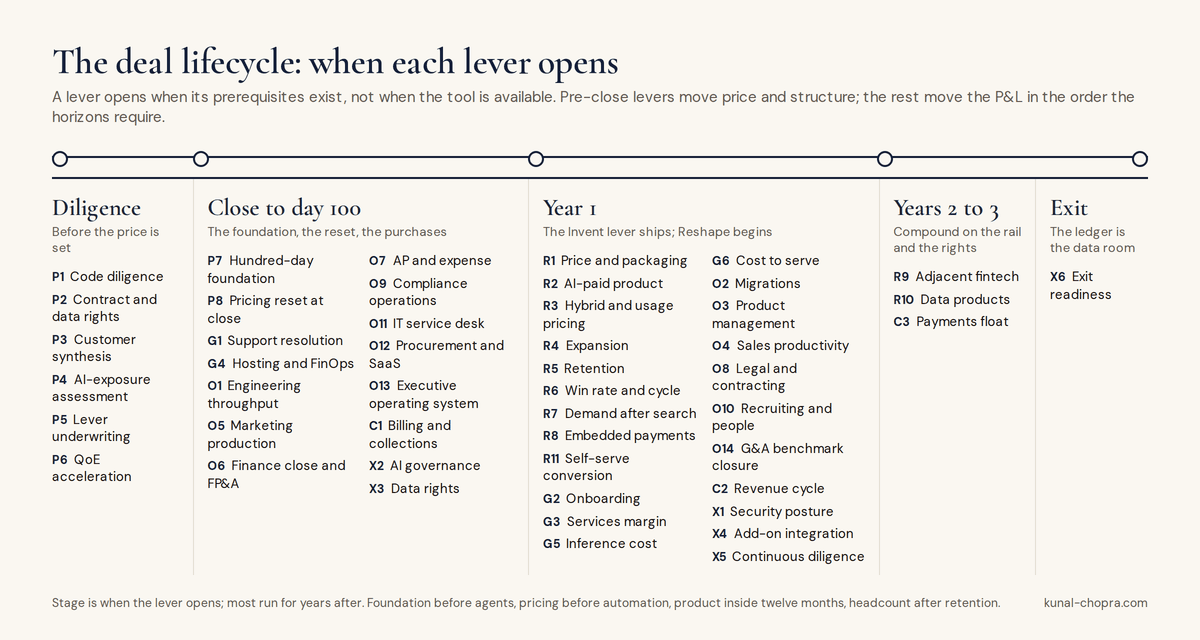
The P&L is the primary axis of this book and the deal lifecycle is the second. Eight levers act before or at close and move price, structure and risk rather than the portfolio P&L; they are in Before close. The rest open at different stages: some in the first hundred days, some in year one after the foundation exists, some in years two and three once earlier levers have paid for them, and some only at exit. Every card carries its stage, and the lifecycle strip below the value map shows which levers open when.
The stages are: diligence; close to day one hundred; year one; years two and three; and exit.
What an honest reading of the aggregate evidence says
The aggregate evidence for AI productivity is small, and a bridge built on vendor case studies is a bridge built on survivorship. Humlum and Vestergaard, using Danish administrative data on 25,000 workers, "estimate precise zeros: AI chatbots have had no significant impact on earnings or recorded hours in any occupation," with average time savings of 3%.7 Bain and StepStone's 2026 survey found that within portfolio companies benefits skew toward cost savings, with nearly 40% of GPs expecting no material financial impact from AI in 2026, and that the highest-return uses of the technology are at the firm level, in diligence and sourcing.8
The playbook is built around that reading rather than against it. Its margin does not come from 3% time savings distributed across the headcount. It comes from a handful of discrete structural changes per company: implementation repriced into the subscription, a support function that resolves most of its volume without a person, a finance function of two, a codebase with test coverage, a payments rail the customer runs through, a product tier the customer pays more for. Each of those is a role redesign or a pricing decision. The technology delivers small gains on average and large gains where a company reorganizes around it, and the entire point of owning the company is that you get to reorganize it.
Part II. The value map
The map is the whole book on one page: forty-eight levers, the line each moves, its horizon, the stage at which it opens, and its evidence grade. The chapter carrying each group follows the identifier.
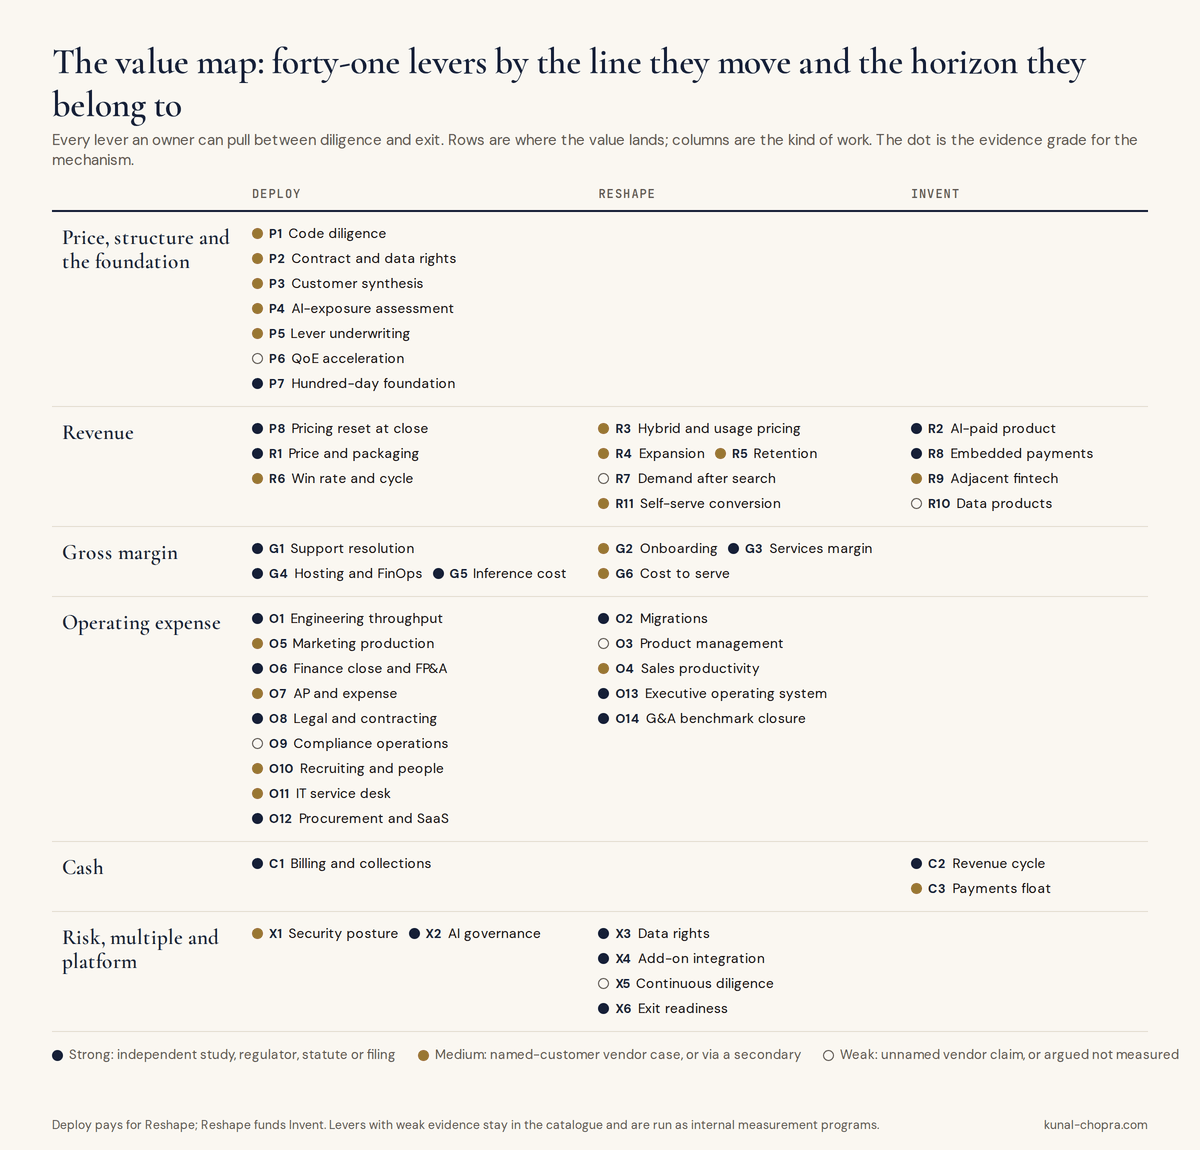
| ID | Lever | Line it moves | Horizon | Opens | Evidence |
|---|---|---|---|---|---|
| P Before close | |||||
| P1 | Code and architecture diligence | Price; capex reserve | Deploy | Diligence | Medium |
| P2 | Contract and data-rights review | Price; reps; what later levers may do | Deploy | Diligence | Medium |
| P3 | Voice-of-customer and churn synthesis | Price; revenue plan assumptions | Deploy | Diligence | Medium |
| P4 | AI-exposure assessment | Price; whether to bid | Deploy | Diligence | Medium |
| P5 | Lever underwriting | Price; structure | Deploy | Diligence | Strong (adoption) / Weak (outcomes) |
| P6 | Financial and quality-of-earnings acceleration | Cost and time of diligence | Deploy | Diligence | Weak |
| P7 | The hundred-day foundation | One-time opex; enables everything | Deploy | Close to day 100 | Strong (mechanism) |
| P8 | Pricing reset at close | Revenue | Deploy | Close to day 100 | Strong |
| R Revenue | |||||
| R1 | Price and packaging | Revenue | Deploy | Day 100 to year 1 | Strong |
| R2 | The AI-paid product | Revenue; R&D mix | Invent | Year 1 | Strong (market) / Medium (attach) |
| R3 | Hybrid and usage pricing | Revenue; net retention | Reshape | Years 1 to 2 | Medium |
| R4 | Expansion and cross-sell | Revenue (net retention) | Reshape | Years 1 to 2 | Medium |
| R5 | Retention | Revenue (gross retention) | Reshape | Years 1 to 3 | Strong (targeting) / Medium (delta) |
| R6 | Win rate and cycle time | Revenue; S&M efficiency | Deploy | Year 1 | Medium |
| R7 | Demand generation after search | Revenue; S&M | Reshape | Years 1 to 2 | Strong (headwind) / Weak (fix) |
| R8 | Embedded payments | Fintech revenue at ~35 to 45% gross margin | Invent | Years 1 to 3 | Strong |
| R9 | Adjacent fintech | Revenue; balance-sheet risk | Invent | Years 2 to 3 | Medium |
| R10 | Data products | Revenue | Invent | Years 2 to 3 | Weak |
| R11 | Self-serve conversion | Revenue; S&M | Reshape | Year 1 | Medium |
| G Gross margin | |||||
| G1 | Support resolution | Support and success COGS | Deploy then Reshape | Day 100 to year 3 | Strong |
| G2 | Onboarding and implementation | Implementation COGS; time to value | Reshape | Years 1 to 2 | Medium |
| G3 | Professional services margin | Services margin; revenue mix | Reshape | Years 1 to 3 | Strong |
| G4 | Hosting and FinOps | Hosting COGS | Deploy | Day 100 to year 1 | Strong |
| G5 | Inference cost management | Hosting COGS; AI-product gross margin | Deploy | Years 1 to 3 | Strong (price trend) / Medium (practice) |
| G6 | Cost to serve | Support and success COGS | Reshape | Years 1 to 2 | Medium |
| O Operating expense | |||||
| O1 | Engineering throughput | R&D | Deploy then Reshape | Day 100 to year 2 | Strong (mixed) |
| O2 | Tech-debt paydown and migrations | R&D one-time; enables G4, X4 | Reshape | Years 1 to 2 | Strong |
| O3 | Product management and research | R&D | Reshape | Year 1 | Weak |
| O4 | Sales productivity | S&M | Reshape | Years 1 to 2 | Medium |
| O5 | Marketing production | S&M | Deploy | Day 100 to year 1 | Medium |
| O6 | Finance close and FP&A | G&A | Deploy | Day 100 to year 1 | Strong (benchmark) / Medium (cases) |
| O7 | Accounts payable and expense | G&A | Deploy | Day 100 | Medium |
| O8 | Legal and contracting | G&A | Deploy | Year 1 | Strong (trial) / Medium (cases) |
| O9 | Compliance operations | G&A; sales cycle | Deploy | Day 100 to year 1 | Weak |
| O10 | Recruiting and people operations | G&A | Deploy | Year 1 | Medium |
| O11 | IT service desk | G&A | Deploy | Day 100 | Medium |
| O12 | Procurement and SaaS spend | G&A | Deploy | Day 100 | Strong (waste) / Medium (savings) |
| O13 | The executive operating system | G&A; governs all | Reshape | Day 100 to exit | Strong (mechanism) |
| O14 | G&A benchmark closure | G&A | Reshape | Years 1 to 3 | Strong |
| C Cash and working capital | |||||
| C1 | Billing and collections | Working capital; bad debt | Deploy | Day 100 to year 1 | Strong |
| C2 | Revenue cycle in the vertical | Customer's cash; the company's product revenue | Invent | Years 1 to 2 | Strong (denials) / Weak (vendor outcomes) |
| C3 | Payments timing and float | Working capital; fintech revenue | Invent | Years 2 to 3 | Medium |
| X Risk, multiple and platform | |||||
| X1 | Security and compliance posture | Multiple; win rate | Deploy | Year 1 | Medium |
| X2 | AI governance and product liability | G&A; risk retained | Deploy | Day 100 to year 1 | Strong |
| X3 | Data governance and rights | Multiple; enables R2 and R10 | Reshape | Day 100 to year 1 | Strong |
| X4 | Add-on integration | One-time integration cost; combined-scale savings | Reshape | Years 1 to 3 | Strong (volume) / Medium (cost) |
| X5 | Continuous diligence | Price paid on add-ons | Reshape | Year 1 to exit | Weak |
| X6 | Exit readiness | Multiple | Reshape | Year 2 to exit | Strong (multiples) / Medium (premium) |
Reading the map
Three patterns are worth seeing before the detail.
The strong evidence clusters in the boring places. Pricing, support resolution, finance close, cloud waste, collections, the valuation arithmetic and the statutes that govern AI are the levers with independent or primary evidence behind them, and they are also the least discussed. The weak evidence clusters where the marketing is loudest: agentic sales, implementation, procurement, recruiting quality, and "AI governance programs" whose cost nobody has published.
The Invent levers are few and they are where the multiple lives. R2, R8, R9, R10 and C2 are the only levers on the map that create revenue the customer did not pay before. They depend on levers that come earlier (P2 for data rights, P7 for the foundation, X3 for governance), which is why the horizons run in order.
Operating expense has the most levers and the smallest individual moves. Hackett's July 2026 benchmark of the thousand largest North American public companies puts median SG&A at 16.2% of revenue against 7.8% for the first quartile, an 8.4-point gap that existed before any of these tools did.9 O6 through O12 are the means of closing a gap the best-run companies had already closed; O14 is the sum. That reframing sets the ceiling where it belongs: the G&A prize is large, it is not new, and AI is the cheapest way yet to reach it.
The chapters
- Before close: P1 to P8, and what goes in the model.
- Revenue: R1 to R11.
- Gross margin: G1 to G6.
- Operating expense: O1 to O14.
- Cash and working capital: C1 to C3.
- Risk, the multiple and the platform: X1 to X6.
- Five companies: the archetypes, their bridges, and their traps.
- The case study: a $10M home-care software company, function by function, from 25% to 41% EBITDA.
- Running it: the register, the initiative card, the cadence, what goes wrong, and the objection.
- Appendix: benchmarks by lever, glossary, sources.
— Kunal
Sources
Every source was opened during the preparation of this playbook in September 2026. (I) marks independent studies, surveys, standards, regulators and primary filings; (V) marks vendor-published results with a named customer; (V, anonymous) marks vendor results without one.
- Meritech Capital, "Meritech Software Pulse," April 9, 2026: median NTM revenue multiple under 3x, median ARR multiple 3.2x, 63% below the pre-ZIRP median; share-price declines "more pronounced in companies with AI tailwinds." https://meritech.substack.com/p/meritech-software-pulse-09-april (I)↩
- Orlando Bravo, CNBC, March 2026, as reported by Bloomberg (Preeti Singh, Allison McNeely), "Software Buyout King Orlando Bravo Attempts an AI-Era Reboot," June 25, 2026, via Insurance Journal; Fund XIV at 5.8% annualized net IRR. https://www.insurancejournal.com/news/southeast/2026/06/25/875314.htm (I)↩
- MIT NANDA, The GenAI Divide: State of AI in Business 2025, July 2025, https://mlq.ai/media/quarterly_decks/v0.1_State_of_AI_in_Business_2025_Report.pdf (I, methodology contested); Gartner, "Gartner Predicts Over 40% of Agentic AI Projects Will Be Canceled by End of 2027," June 25, 2025, https://www.gartner.com/en/newsroom/press-releases/2025-06-25-gartner-predicts-over-40-percent-of-agentic-ai-projects-will-be-canceled-by-end-of-2027 (I)↩
- FTI Consulting, "AI Speeds Up Returns in Private Equity as M&A Becomes Top Value Generator for Firms," 2026 Private Equity Value Creation Index, June 4, 2026, n=555 across 14 countries. https://www.fticonsulting.com/about/newsroom/press-releases/ai-speeds-up-returns-in-private-equity-as-ma-becomes-top-value-generator-for-firms (I)↩
- FTI Consulting, 2026 Private Equity AI Radar, May 19, 2026, n=200. https://www.fticonsulting.com/insights/reports/2026-private-equity-ai-radar (I)↩
- McKinsey & Company, "Beyond productivity: How AI creates value in private equity," June 23, 2026, n=471 PE-backed companies; median revenue multiples 13x, 14x, 20x and 31x by adoption level; no growth-adjusted figures published. https://www.mckinsey.com/capabilities/business-building/our-insights/beyond-productivity-how-ai-creates-value-in-private-equity (I)↩
- Anders Humlum and Emilie Vestergaard, "Large Language Models, Small Labor Market Effects," NBER Working Paper 33777, revised March 2026. https://www.nber.org/papers/w33777 (I)↩
- Bain & Company and StepStone Group, "Private Equity's Reality Check: The GP Outlook for 2026," March 2, 2026, n=103. https://www.bain.com/insights/private-equitys-reality-check-gp-outlook-2026/ (I)↩
- The Hackett Group, "SG&A Costs Reach Five-Year Highs Across North America and Europe," July 27, 2026, FY2025 results of the 1,000 largest public non-financial companies per region. https://www.thehackettgroup.com/the-hackett-group-finds-sga-costs-reach-five-year-highs-across-north-america-and-europe/ (I)↩
Boring AI
AI for manufacturers, operators and service businesses — not startups chasing hype. Every other week.
Your address is used only to send this newsletter. No sharing, no selling, no tracking pixels. Unsubscribe from any issue.